Tour of the Operator UI #
A map of the sidebar entries behind litmus serve, grouped by
the same section bands the sidebar uses. Use this as a "what does each
sidebar entry do" lookup; the per-screen reference pages
have the field-by-field detail.
The operator UI starts when you run litmus serve from a project
root — by default it listens on http://localhost:8000. Open that
URL in a browser; everything below is a click in the left sidebar.
ACTIVE TESTS (dynamic) #
Above the static sidebar groups, an ACTIVE TESTS block appears
whenever a run is in progress. Each row is a link to that run's
live view at /live/<run_id>. If a test is paused waiting for an
operator dialog, the row is amber with a "N dialog(s) waiting"
hint — that's the signal to click in and respond. When no runs are
active, the block is hidden.
NAVIGATION #
The day-to-day workflow lives here: see a run, start a run, browse results, inspect metrics, plot measurements.
Dashboard — / #
The landing page. Shows every station on the bench as a clickable
card (clicking opens /launch?station=<id> pre-filled to that
station) above a "Recent Runs" table of the last few runs across
the project. No part-based filtering happens here — every
station card is shown unconditionally.
Launch Test — /launch #
A single-form view for starting a test from the browser instead of
the CLI. Fields in order: Part, UUT Serial, Test Path, Station,
Mock Hardware, Operator. Click Start Test to redirect to the live
monitor at /live/<run_id>. Pre-fill via ?part=&station=&mock=1
URL parameters.
Results — /results #
The run-history table. One row per run with filters above:
date range, part, station, outcome. Click any row to drill into
the detail view at /results/<run_id> (overview card, step tree,
measurements table).
→ Results list · Results detail
Metrics — /metrics #
Six analytical lenses on the run history (Yield, Pareto, Ppk, Retest, Time loss, Assets). Filters above the tab strip — same filter set as the Results list, applied to whichever lens is active. Best entry point for "is the line healthy" questions.
Measurements — /explore #
The measurement-level browser. One row per logged measurement, with optional time-series plot above the table when a characteristic is selected. The "if I plotted every reading for this characteristic across the last week of runs, what would it look like" view.
DATA STORES #
The raw streams behind the analytical views.
Events — /events #
The event log browser — every event the framework emitted, in chronological order. Filters by Event type, Role, Since (time cutoff), and row Limit; a specific session can be pinned via the URL. Useful for debugging "what actually happened" when a run looks wrong.
Channels — /channels #
The channel store. One row per logged channel (a named time-series
written via context.observe(key, value)); click a row to see its
full time-series plot. The "what was the voltage doing over the
run" view.
→ Channels list · Channels detail
Files — /files #
The file store. One row per captured artifact — scope screenshots,
vendor capture files, and byte streams written via observe(...) or
files.stream. Open a row to view or download the file. The "show me
the photo or capture this run saved" view.
CONFIGURATION #
The entities Litmus tests against — stations, parts, fixtures, instruments, tests, plus the visual designer that wires them together.
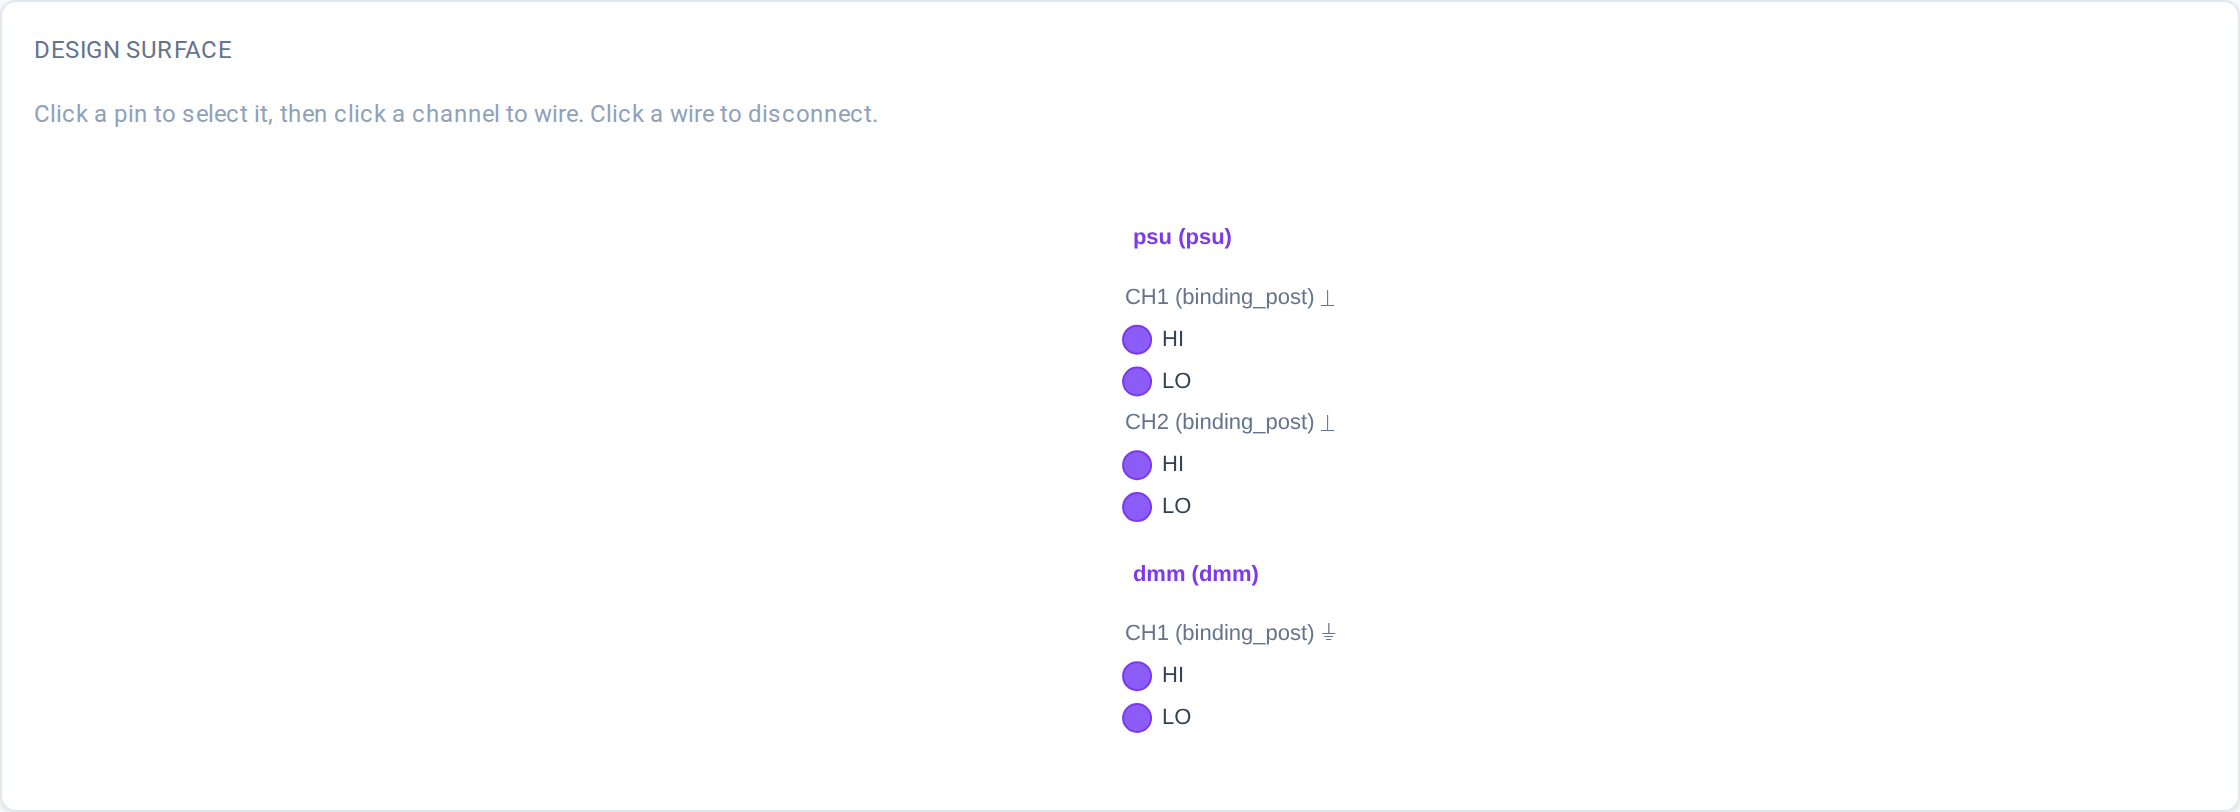
System Designer — /designer (experimental) #
The interactive fixture-wiring surface. Pick a part, pick a station, click a pin, click a channel — wire saved to disk. The fastest way to author or refine a fixture YAML without touching the file directly.
Stations — /stations #
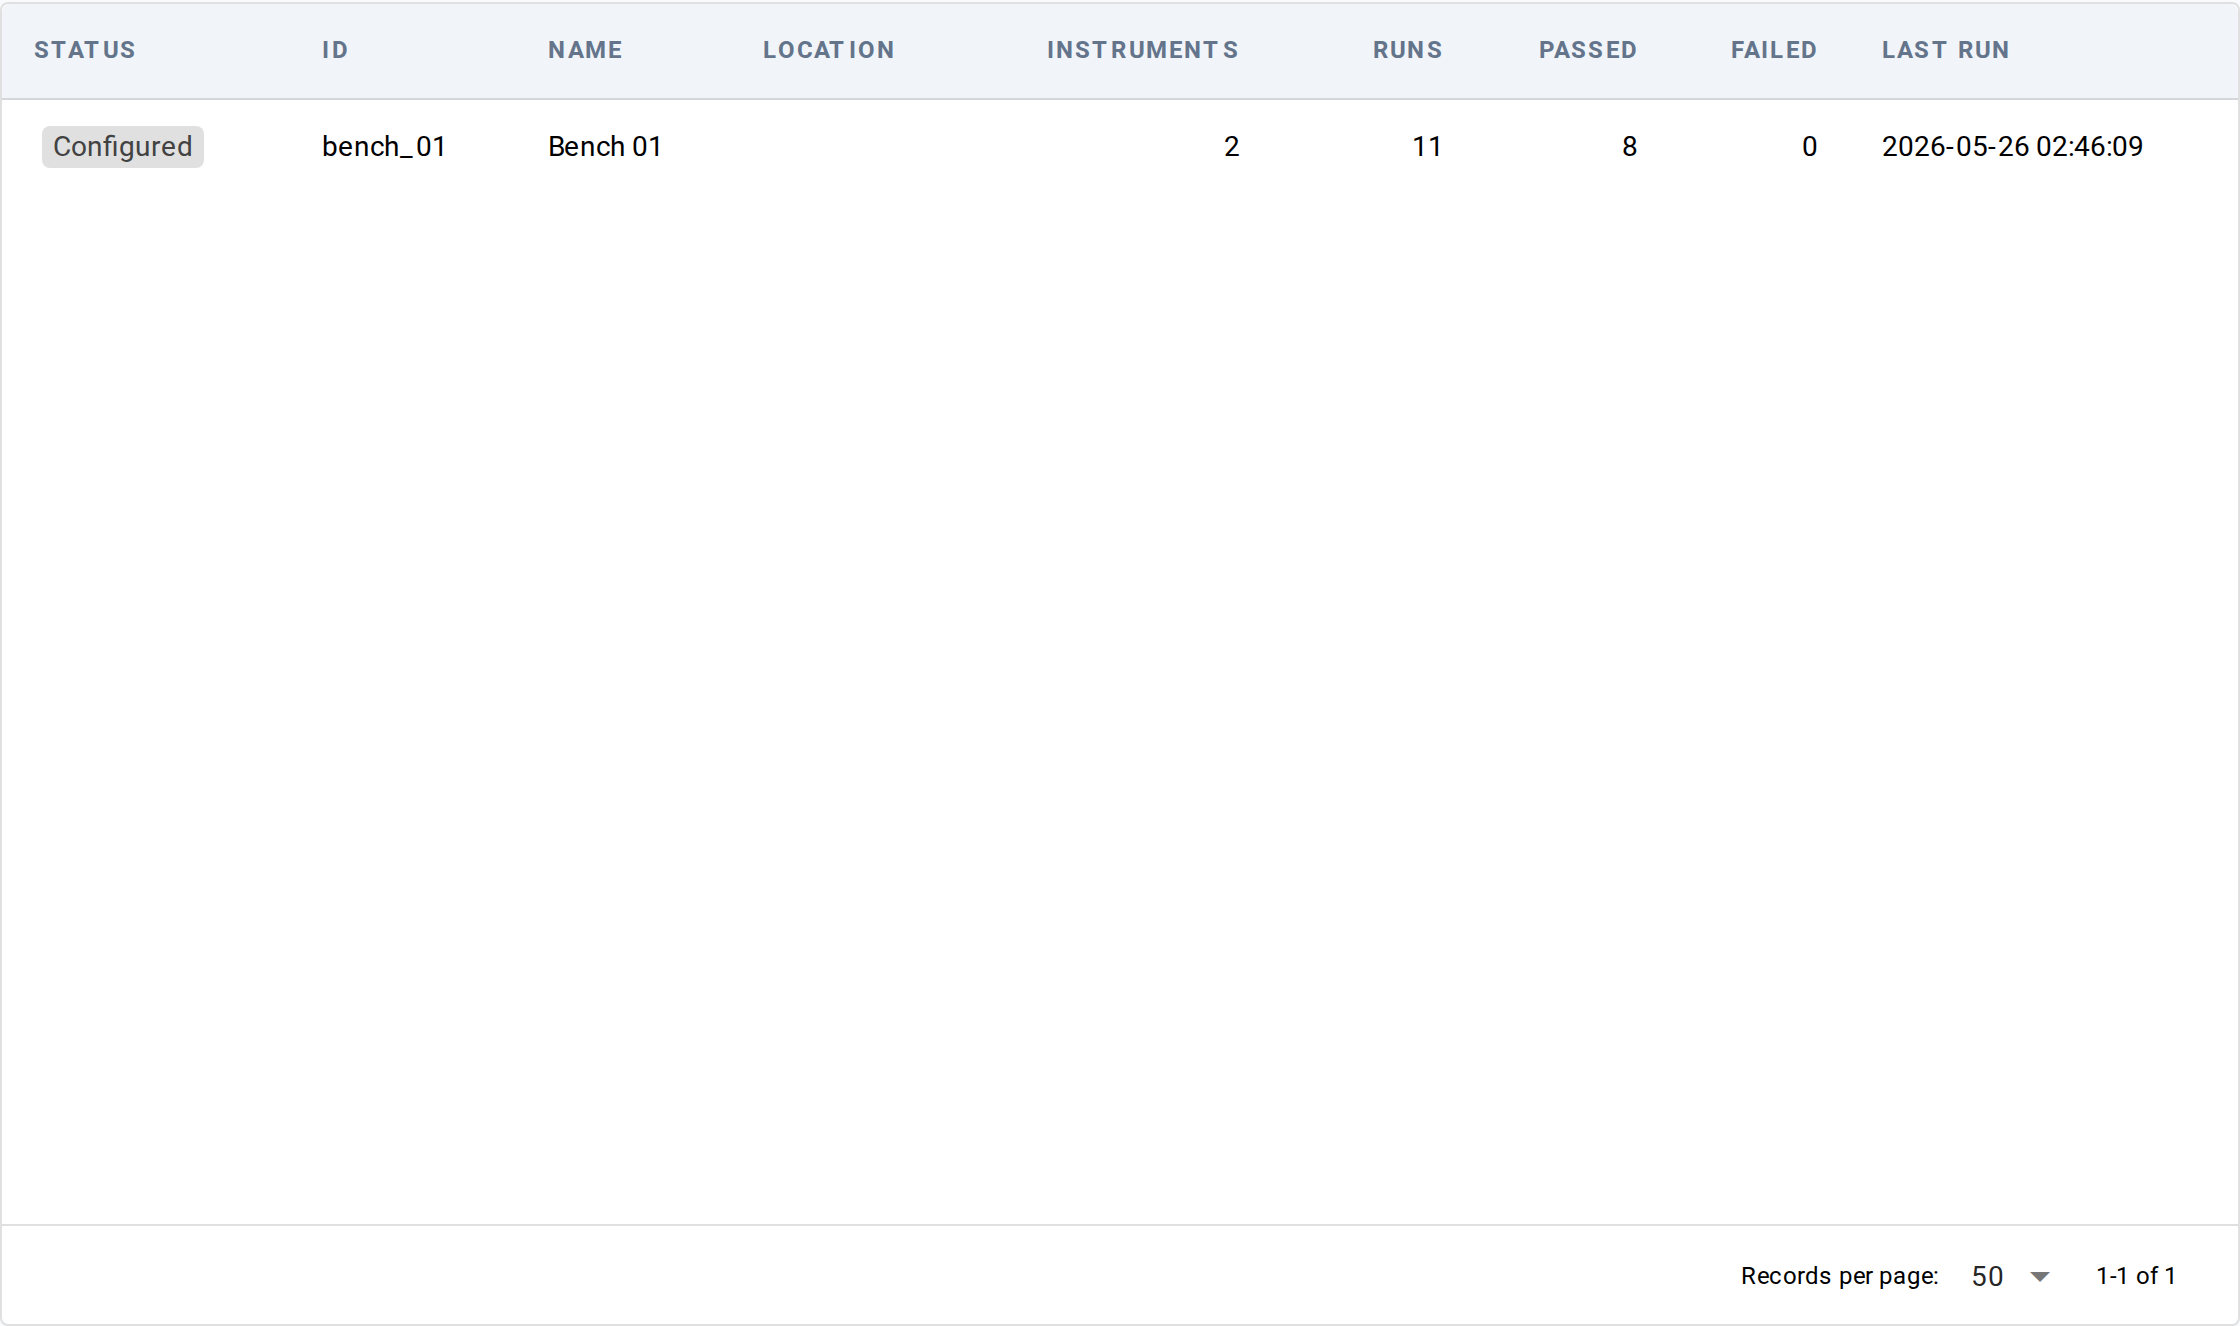
Browse, edit, and create stations. One station = one bench's worth
of instruments. The list page also picks up stations Litmus has
seen in run history but doesn't have YAML for — tagged with a
Configured / Observed chip and filterable from the row above.
Parts — /parts #
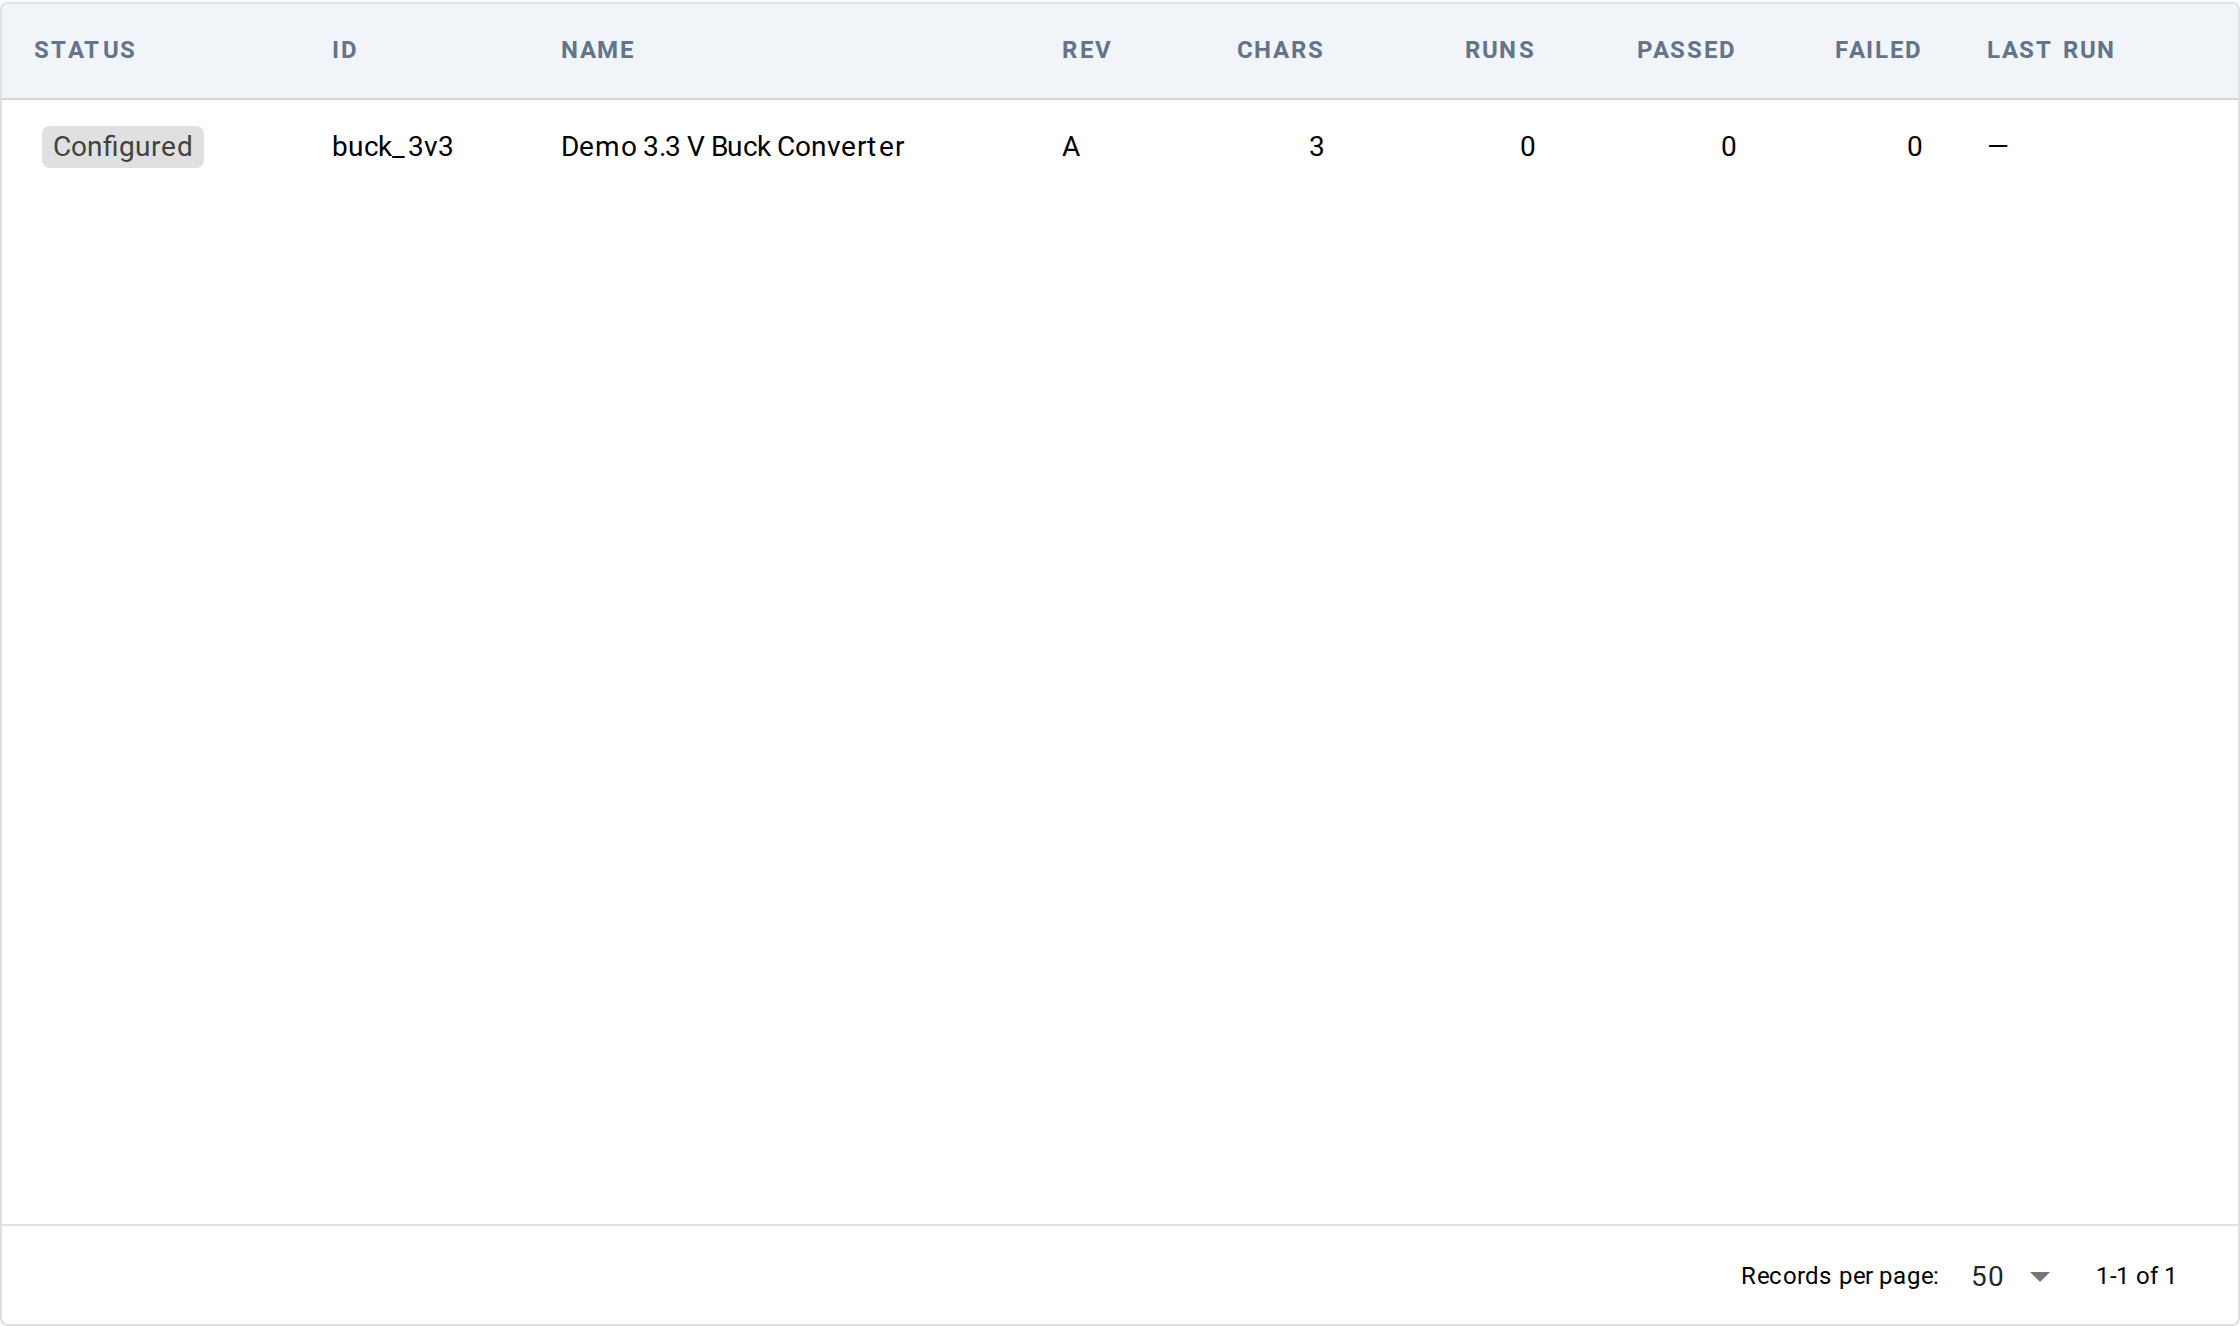
Browse, edit, and create parts. One part = one UUT type
(part number + revision) with its pin map and characteristics.
Same Configured / Observed treatment as Stations — a part
number that appears in run history with no YAML shows up tagged
Observed.
Fixtures — /fixtures #
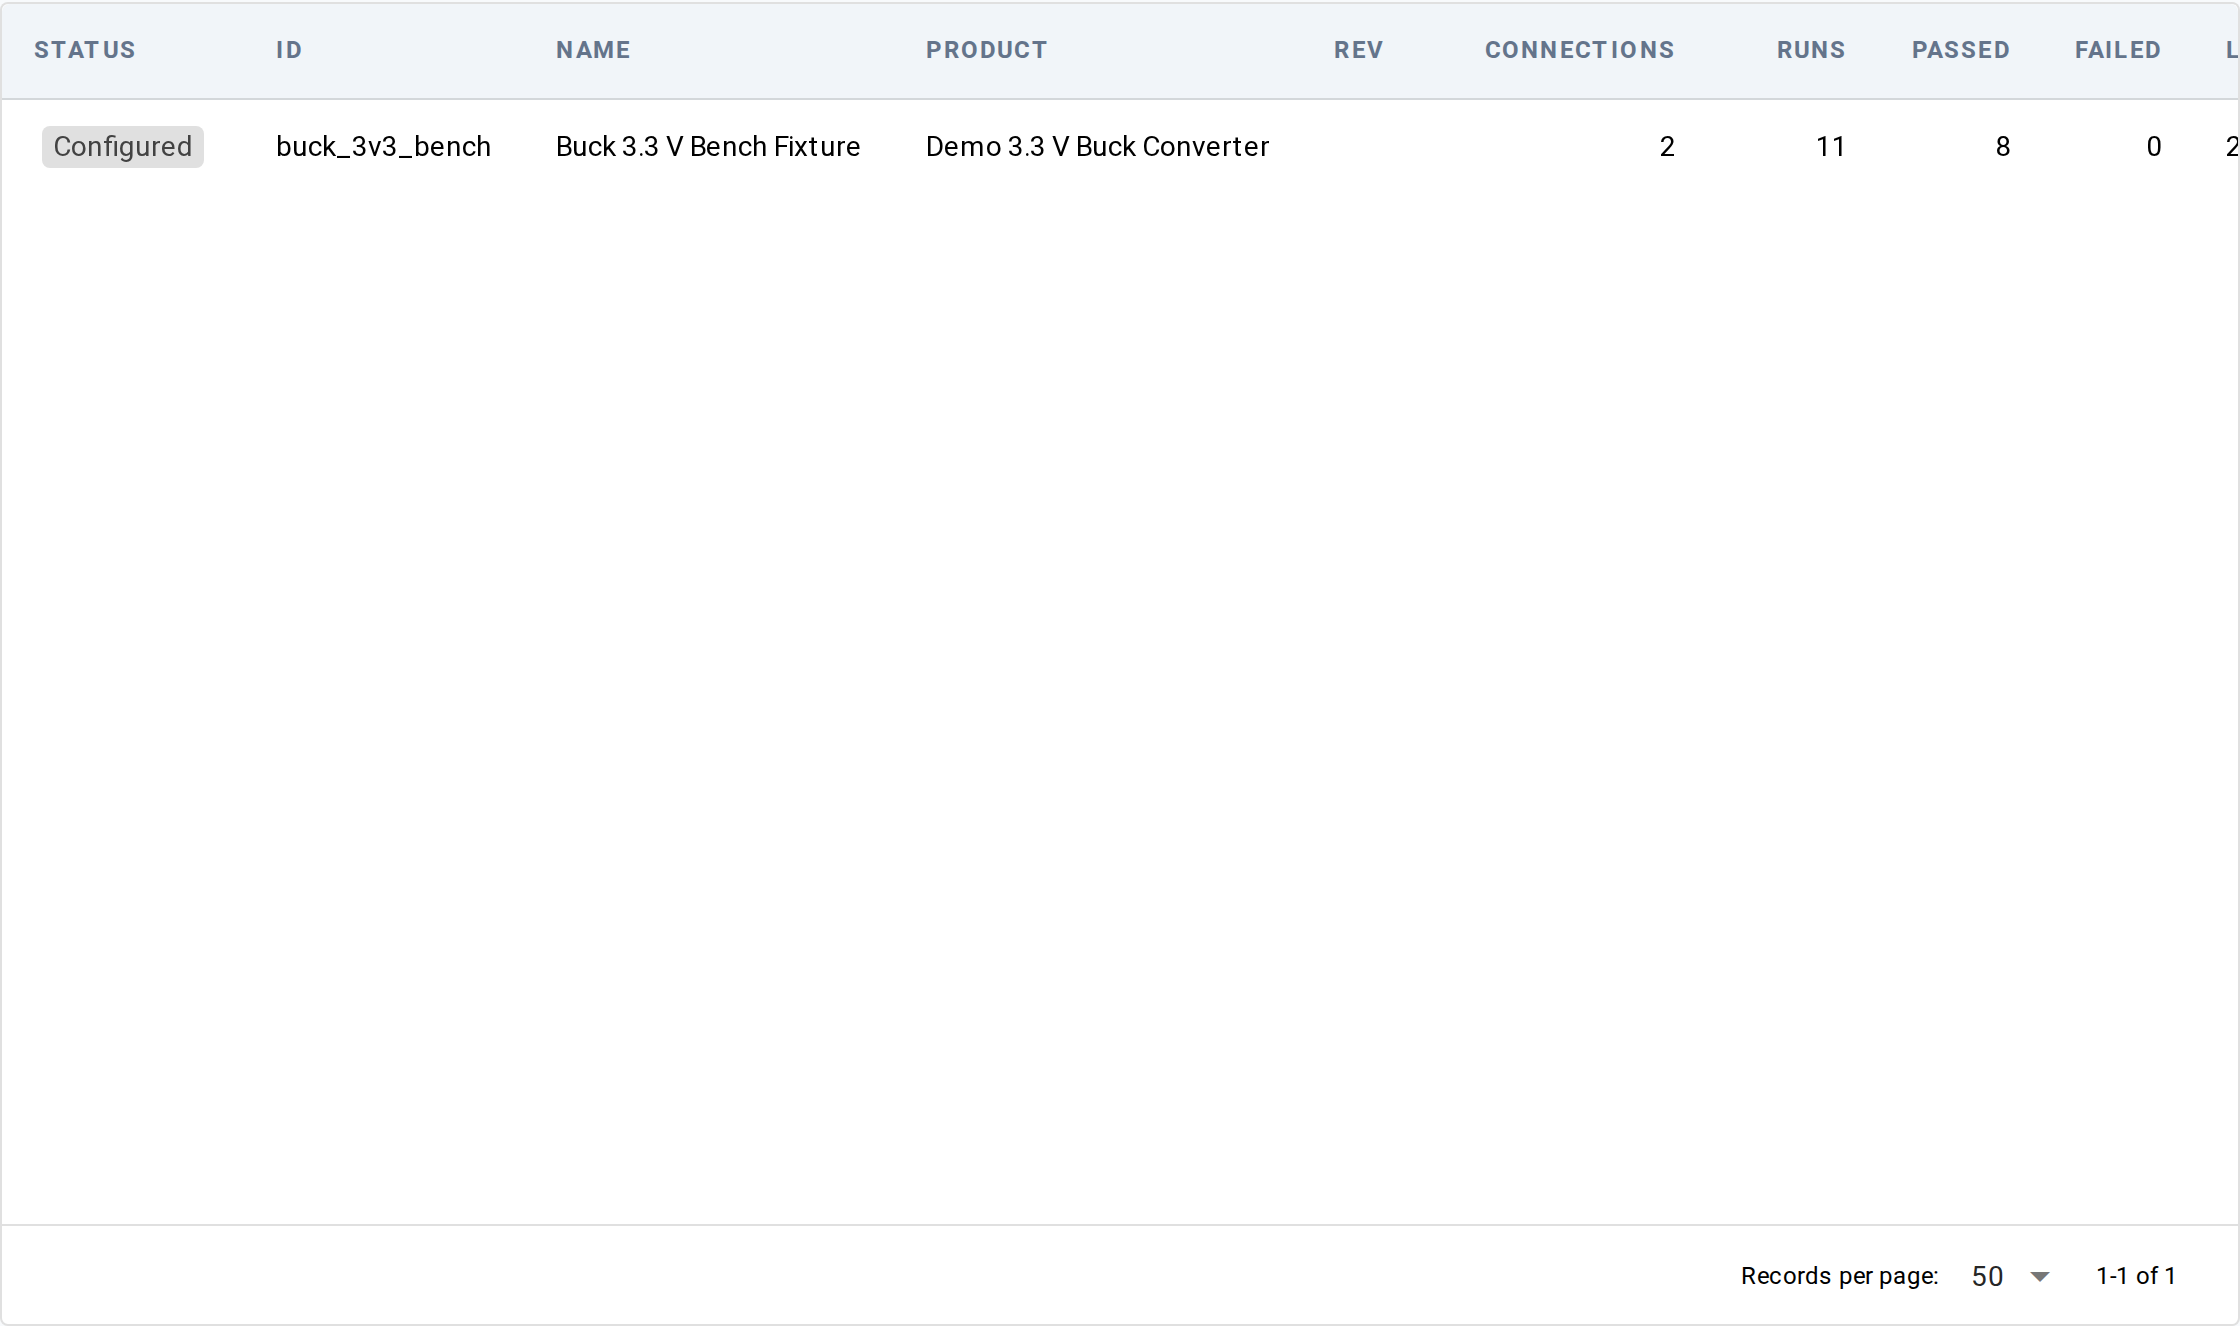
Browse, edit, and create fixtures. One fixture = the wiring between a part's pins and a station's instrument channels. The detail view's Diagram tab renders the connection map as Mermaid.
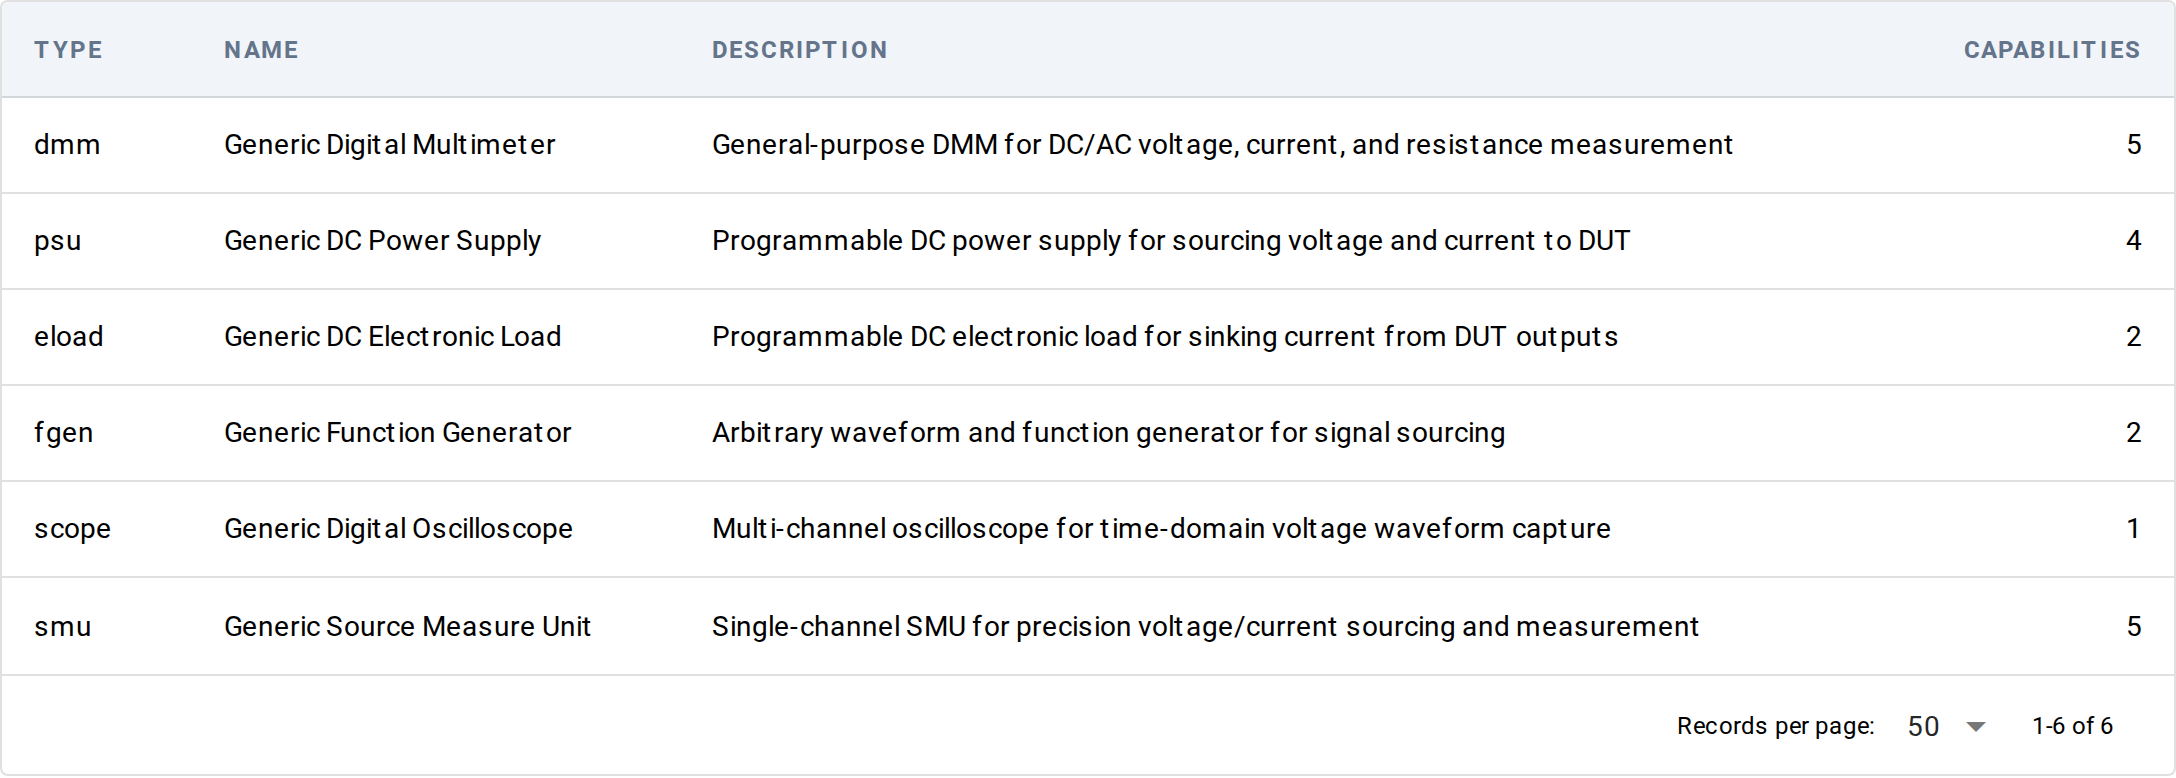
Instruments — /instruments #
Two tabs: Catalog (instrument types — the templates that
describe capabilities) and Inventory (physical assets — the
actual units on the bench with serial numbers and calibration
dates). The Inventory tab tags each asset Configured, In use, or
Observed — an instrument seen in run history but with no asset
YAML on the bench shows up as Observed.
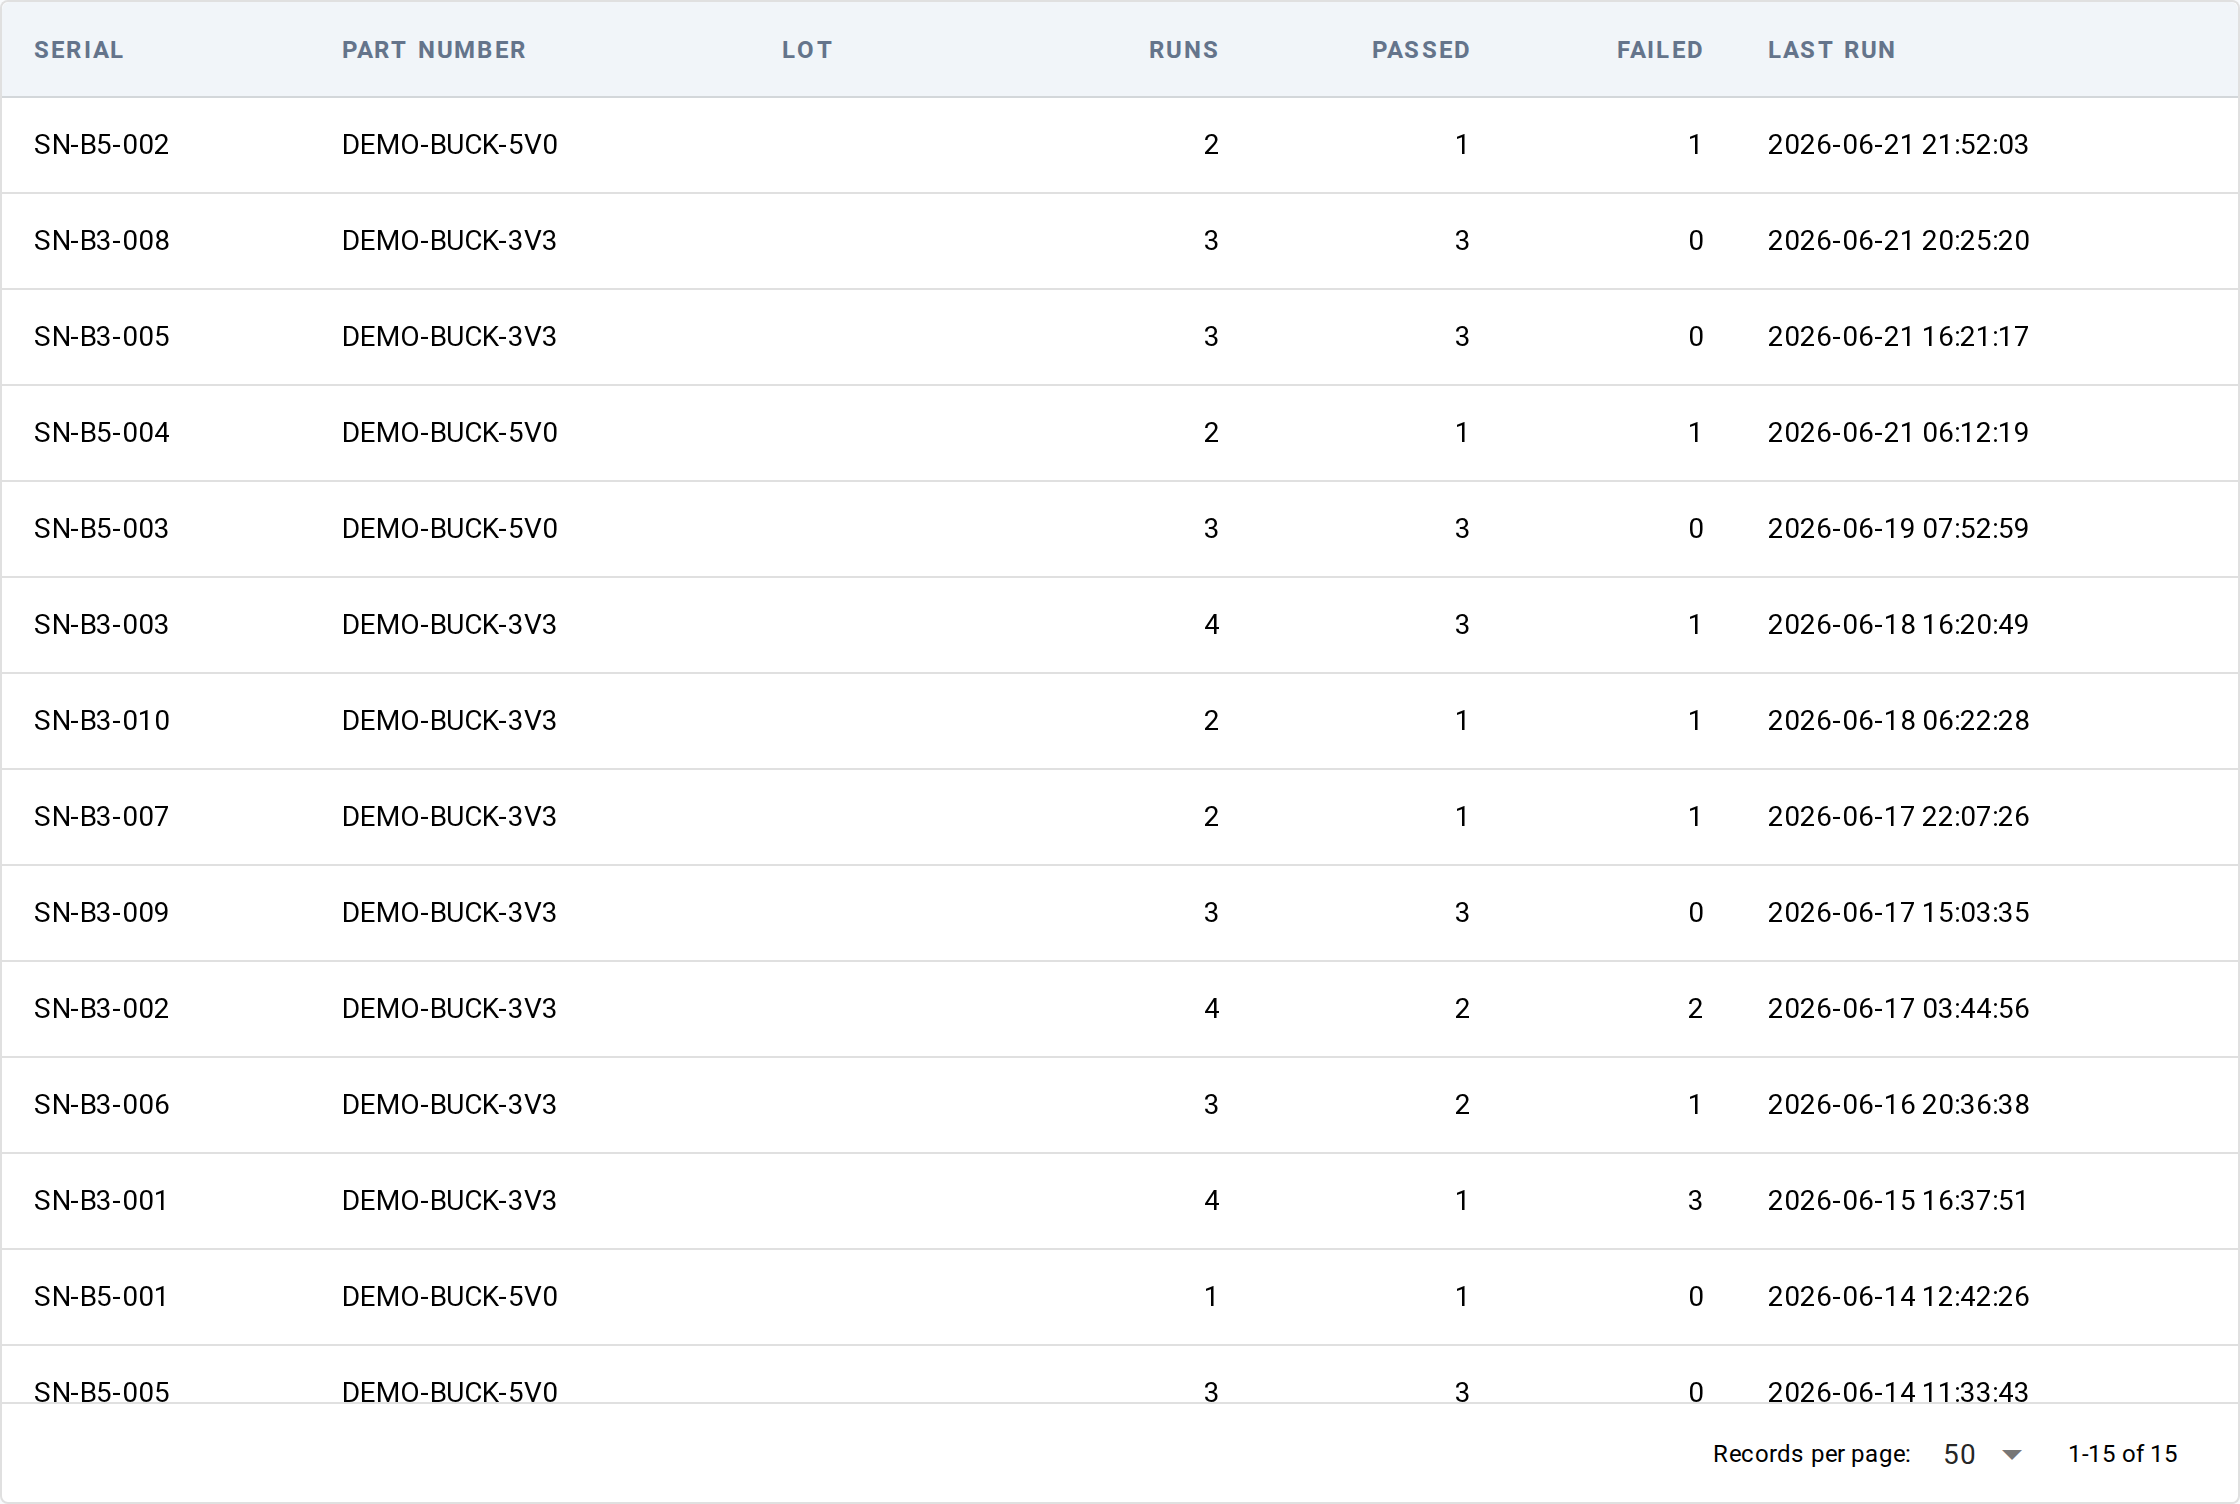
UUTs — /uuts #
The list of every UUT serial Litmus has seen in run history. UUTs
aren't configured ahead of time — each serial is recorded as it's
tested — so every row comes from run history; no
Configured / Observed chip is needed. Columns: serial, part
number, lot, runs, passed, failed, last run.
Tests — /tests #
A flat table inventory of the test directories Litmus discovered
under tests/. Click a row for the detail view at /tests/<path>:
the test source (read-only) and the colocated sidecar YAML side by
side, plus a per-file Launch Test shortcut. The Launch Test form's
Test Path dropdown is populated from the same source.

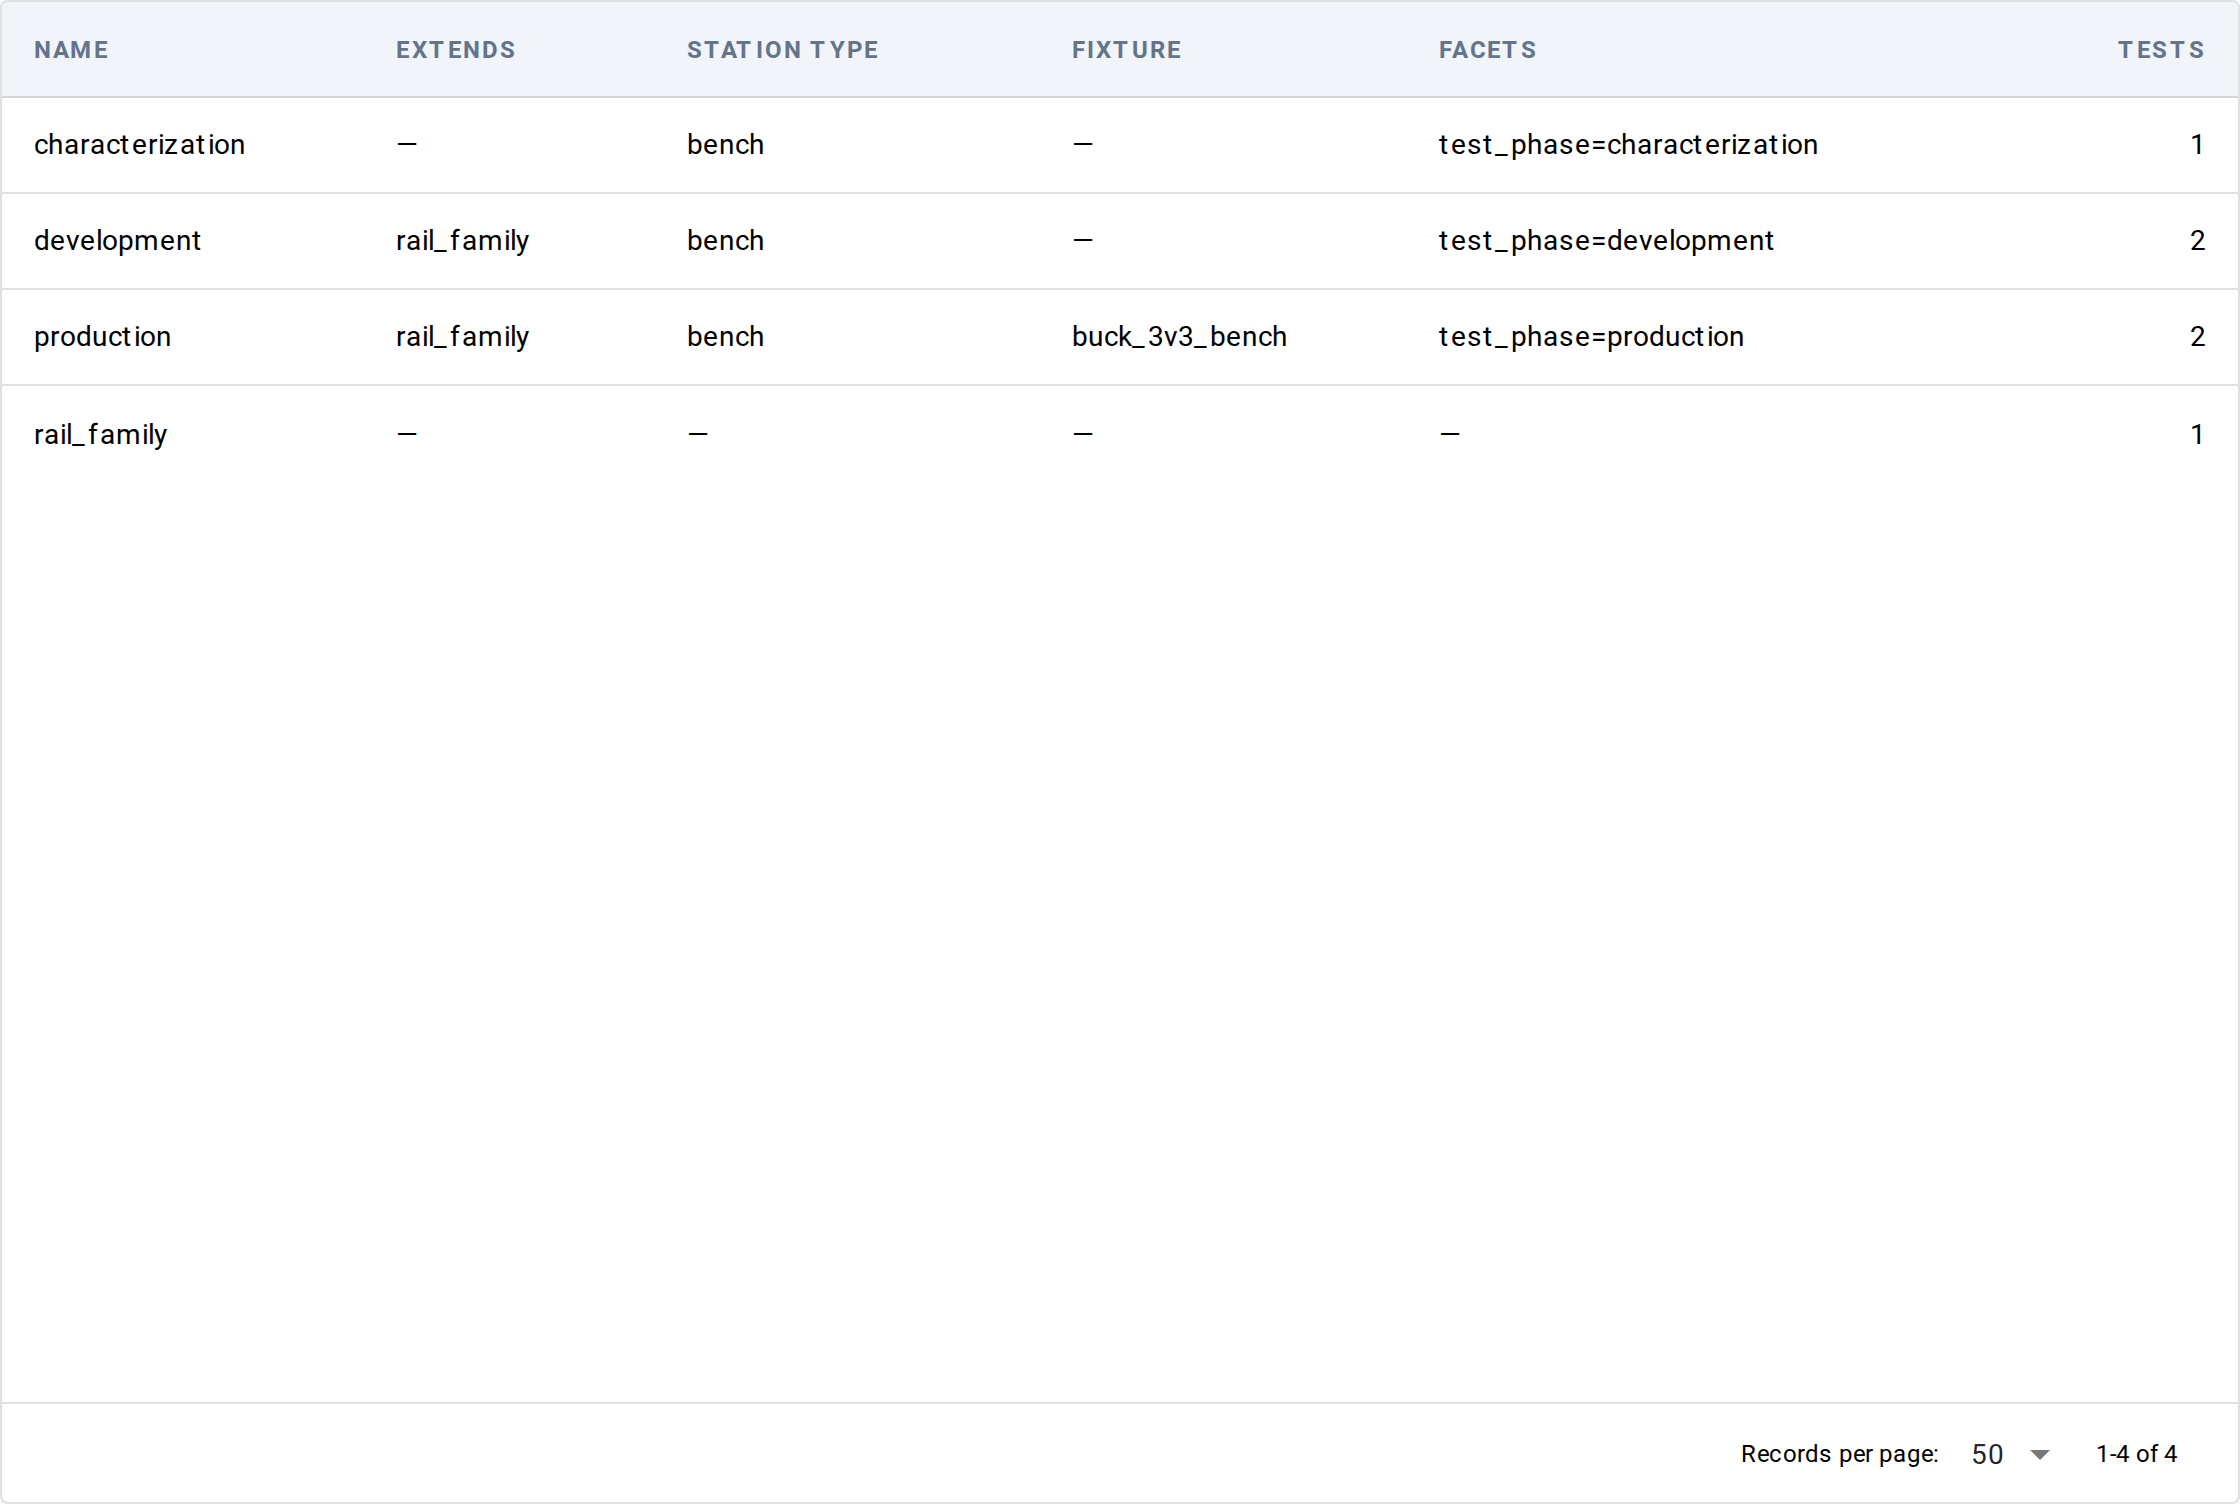
Profiles — /profiles #
Browse the project's configured profiles. One profile = one
named bundle of test config (limits, sweeps, mocks,
characteristics, etc.) that overrides each test's sidecar at
session start. Loaded from litmus.yaml: profiles: and
profiles/*.yaml. Detail view shows the resolved YAML, the
extends: inheritance chain, and a Launch Test shortcut that
pre-fills ?test_profile=<name>.
DOCUMENTATION #
Documentation — /docs #
The in-app docs viewer. Renders the same Markdown corpus
pragmatest.com renders. Most
content is served locally; Mermaid diagrams load their renderer
from cdn.jsdelivr.net, so air-gapped benches see code blocks
where the diagrams would be.
Common starting points #
- "My run failed and I want to know why" → Results list, click the failing run, drill into Steps. Find flaky tests walks the deeper diagnostic flow.
- "Is yield trending down?" → Metrics → Yield tab, filter by part or station.
- "What did this channel look like during the failure?" → Channels, click the channel, scroll to the run time-range.
- "I need to wire up a new fixture" → System Designer, pick part + station, click pins → click channels.
See also #
- Per-screen reference pages — the field-by-field detail behind everything above
- Find flaky tests — a task-driven recipe that combines Results + Metrics views
- Compare two runs — diff two run records side-by-side using the Results view