Channels — list view #
URL: /channels
Every channel Litmus has seen — streaming numeric / array signals captured during test runs (scope traces, PSU readback, sensor logs). Each row shows a live sparkline of the last 50 samples and the latest value; values update in place as new samples arrive. Click a row to drill into the single-channel chart.
Table #
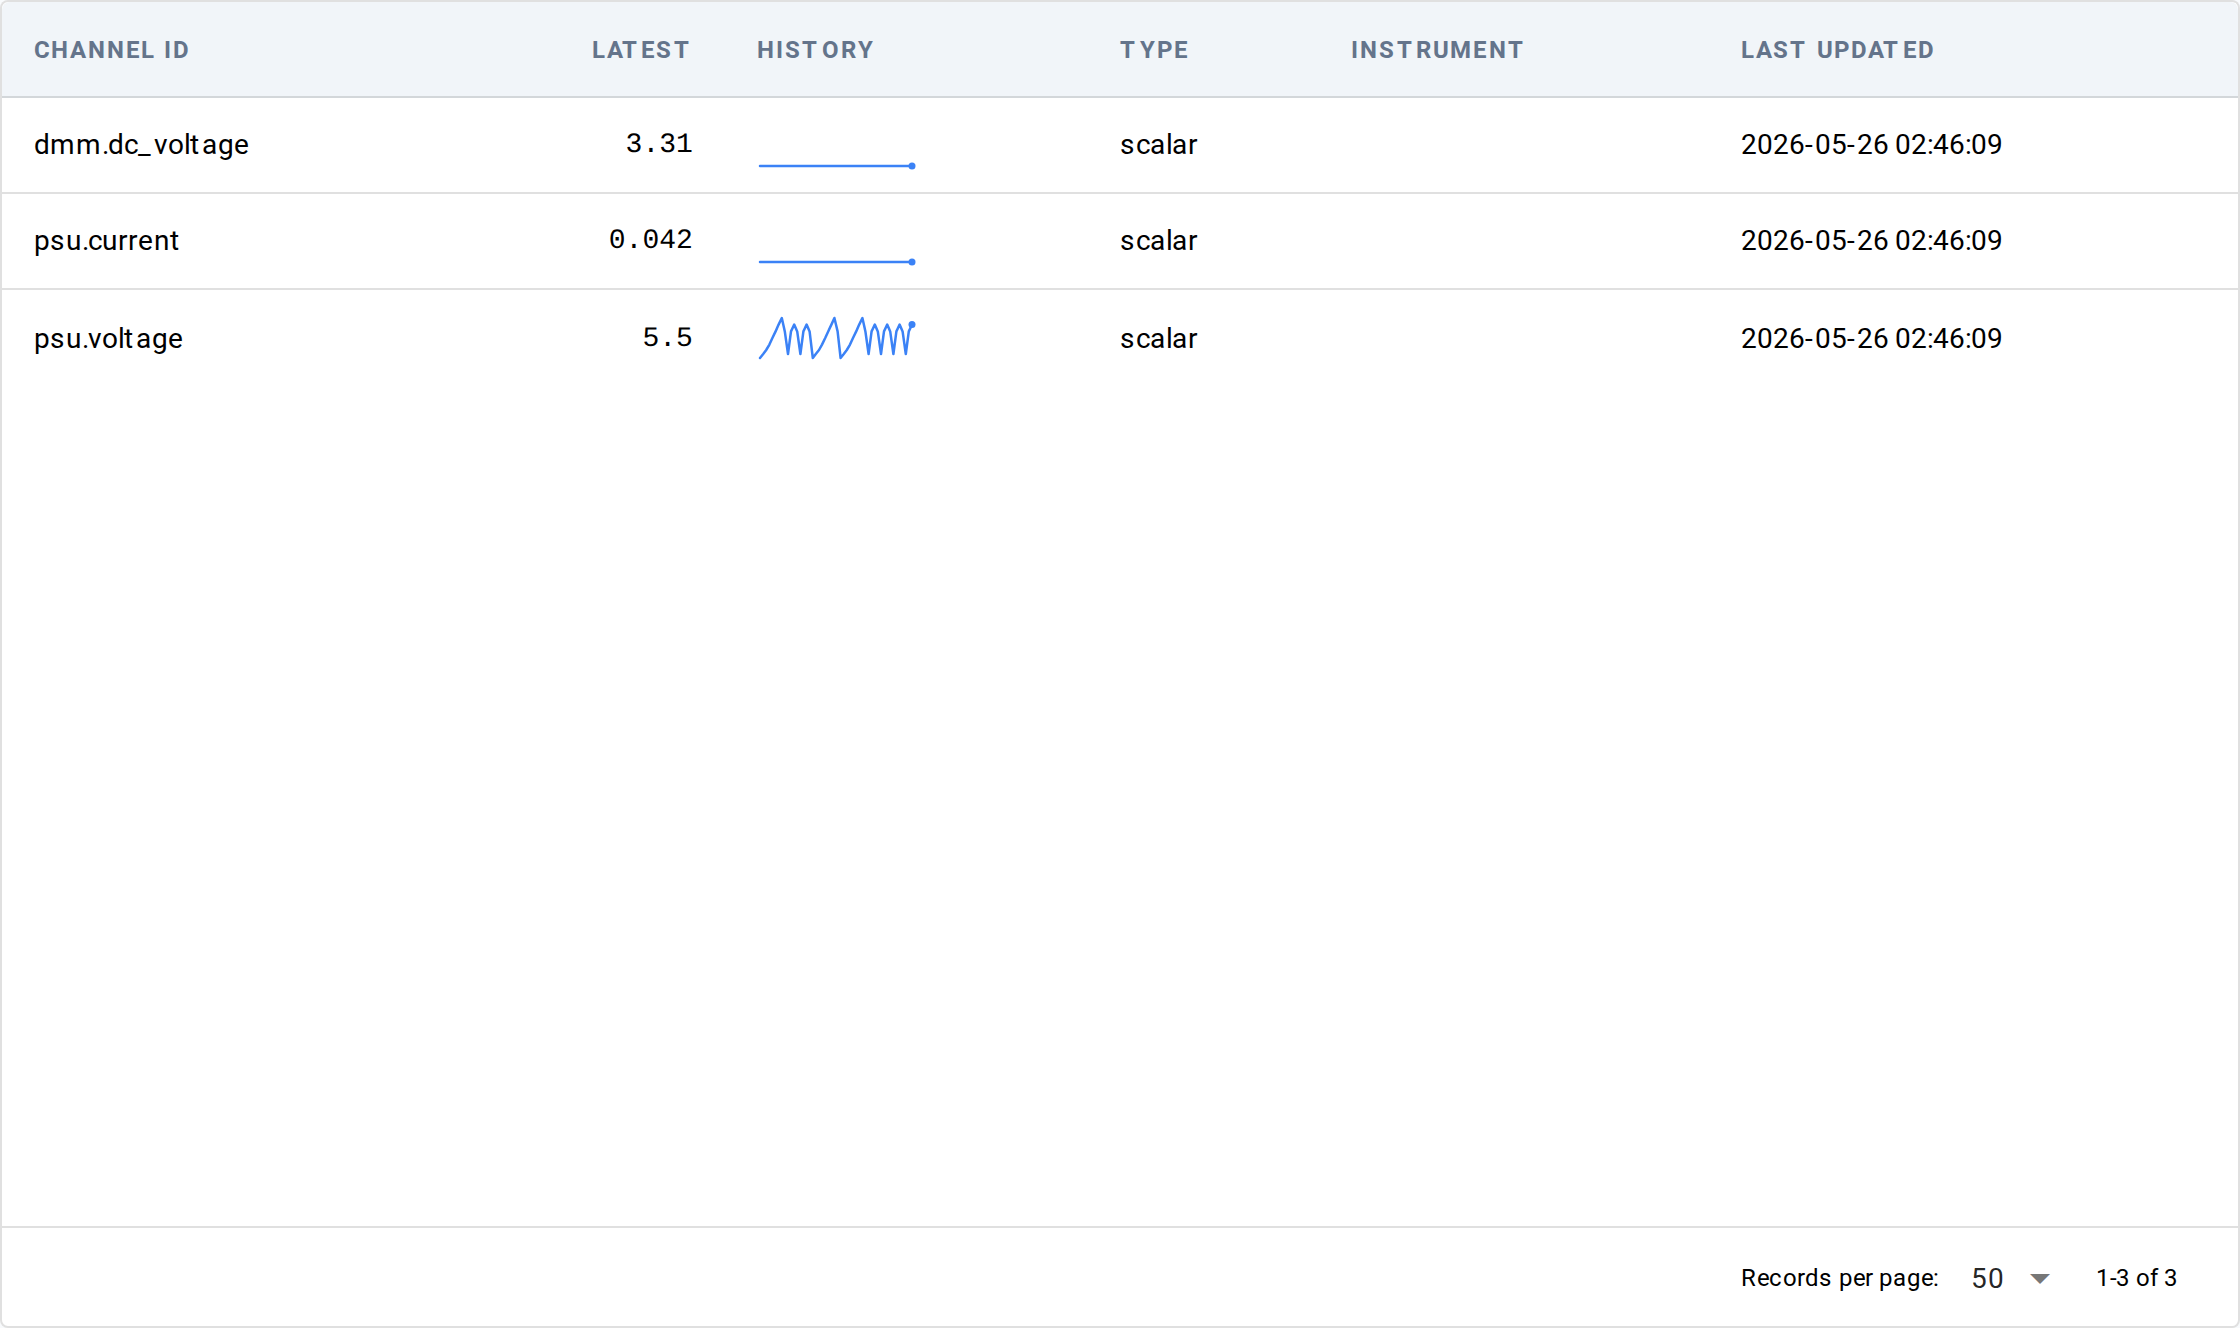
A count above the table tells you how many channels have been seen.
| Column | What it shows |
|---|---|
| Channel ID | The channel's identifier — typically <instrument-role>.<signal> or <channel-name> |
| Latest | The most recent sample, with units appended when known. — when no samples yet. |
| History | An inline sparkline of the last 50 samples (or — for series with fewer than 2 samples). |
| Type | Sample data type (e.g. scalar:float, array:float) from the channel descriptor |
| Instrument | The instrument role this channel belongs to, when known |
| Last updated | When the most recent sample arrived, in browser-local time |
The table is dense — rows are about 30 pixels tall; sparklines render inside the row at 80×24 pixels.
Filters #
A filter card above the table narrows the list: Channel ID contains, Type, Instrument, and a Since / Until date window, plus a Refresh button. When you arrive from a run (via its detail page), a banner scopes the list to that session with a Clear button.
Live updates #
The view refreshes live as channels appear and update — no manual reload needed. Cells re-render in place; unchanged rows don't repaint, so the view stays calm during quiet periods. If live events aren't available, the page falls back to polling every couple of seconds.
Empty state #
When no channels have been written yet, the table is replaced with a card
explaining how channels get populated: "Channels appear once a test
writes to the channel store (e.g. context.observe('scope', value)
or instrument observers)."
Underlying data #
Channel samples are stored separately from runs and measurements.
Programmatic access goes through ChannelStore
(from litmus.data.channels.store import ChannelStore); there is no
first-class CLI equivalent today.
Common tasks #
- Watch a sensor live during a test — open
/channels, find the row, watch the Latest column and sparkline update. - Drill into one channel's full history — click any row to open the single-channel detail with a full chart + raw data table + session/date filters.
See also #
- Channel detail — the per-channel view you reach by clicking a row
- Concepts → Data stores — why ChannelStore is separate from EventStore and the parquet runs index