Results — list view #
URL: /results
Every Litmus run lands in this table — finished and in-flight side by side — sorted by start time, newest first. The view has two parts: a stats strip above the table and the table itself.
Use it to find a specific run by serial, scan today's pass rate, drill into a failing run, or watch a station's activity live.
Stats row #

When the table has rows, a card strip above the table summarises the current page's outcomes:
| Stat | Meaning |
|---|---|
| Total Runs | Total run count across all runs Litmus has recorded — not just the visible page. |
| Pass Rate (page) | Percentage of rows on the visible page with outcome Passed. |
| Passed | Rows on the visible page with outcome Passed (green chip). |
| Failed | Rows on the visible page with outcome Failed (red chip). |
| Errored | Rows on the visible page with outcome Errored (amber chip). |
| Latest | Start time of the newest run on the visible page (the table is always ordered newest-first). |
The rates and counts (except Total Runs) follow pagination — flip to the next page and the numbers reflect that page's outcomes.
Table #
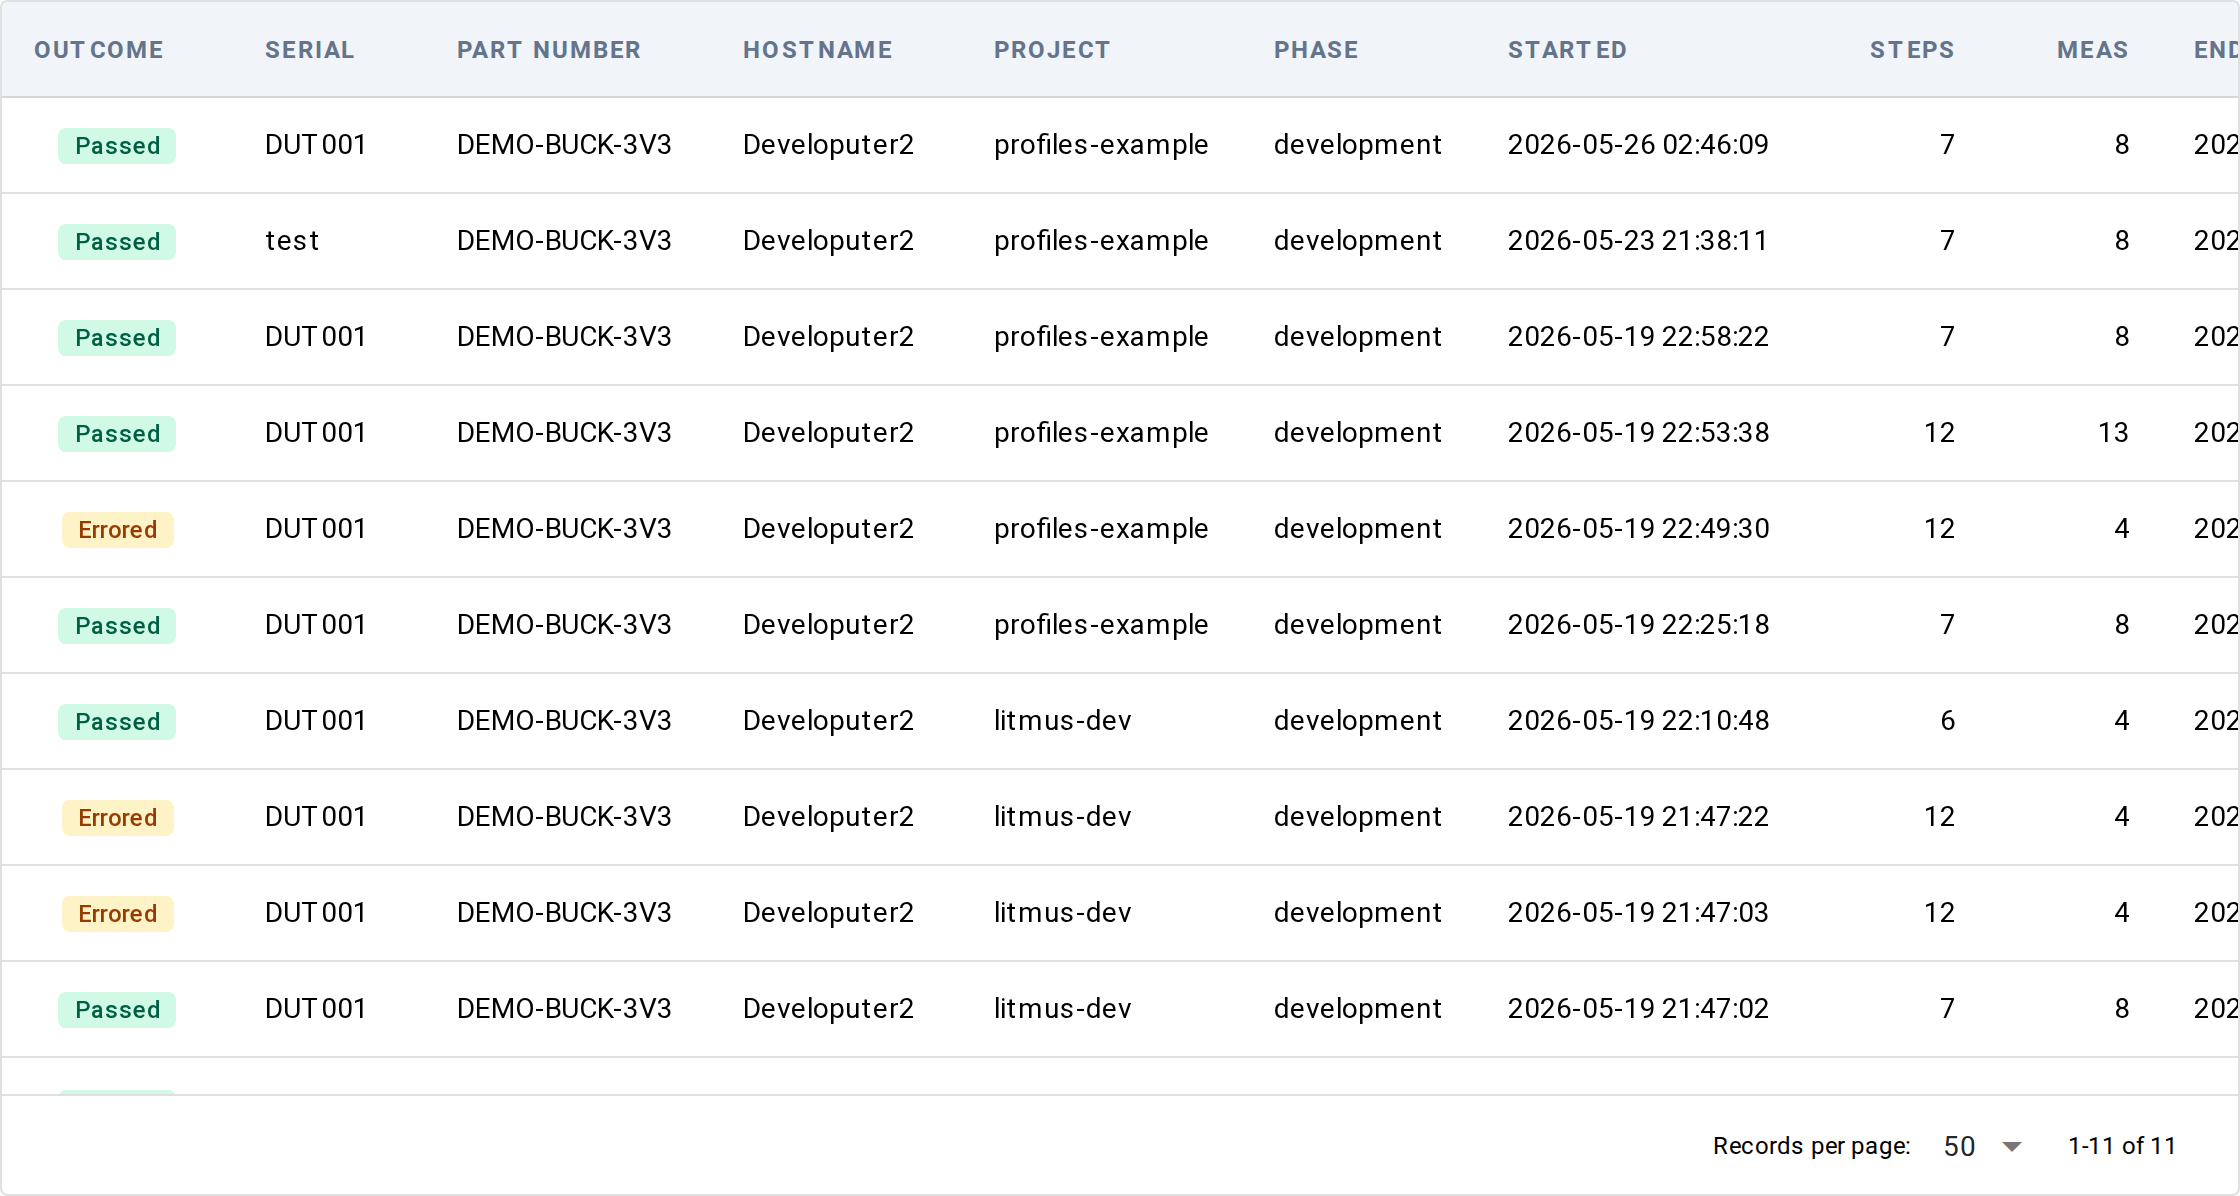
Click a row to open the run's detail page at /results/{run_id}.
| Column | What it shows |
|---|---|
| Outcome | Colored chip — Passed, Failed, Errored, Skipped, Aborted, Terminated, Done, or Running for in-flight runs |
| Serial | UUT serial number stamped on the run |
| Part Number | UUT part number |
| Hostname | Station hostname that ran the test |
| Project | Project name from litmus.yaml |
| Phase | Test phase facet (e.g. development, production, characterization) |
| Started | Run start timestamp, rendered in browser-local time |
| Steps | Total step count for the run |
| Meas | Total measurement count for the run |
| Ended | Run end timestamp, blank for in-flight runs |
The table body scrolls, the header stays pinned, and rows are always ordered by start time, newest first. Cells with no value (e.g. a run with no part number stamped) render blank.
The pagination footer at the bottom shows the current range
(1-50 of N) and a rows-per-page selector with options of 10, 25, 50,
100, and "all."
Live updates #
The table refreshes itself when runs start and end — no manual reload needed. It shows runs from this project only; runs recorded by other Litmus projects don't appear here.
Empty state #
When the table has no rows, the stats strip is hidden and a single
card appears with a "Launch a Test" button that jumps to the Launch
Test view (/launch). Fresh installs always start in this state.
Underlying data #
The table reads from this project's runs index. Each row corresponds to one Litmus run — the same record you get from:
litmus runson the command linelitmus runs --jsonfor machine-readable outputRunsQueryin the Python query API
For the full schema of one run row, see
Models reference → RunSummary.
For the event log these run rows are derived from, see
Concepts → Event log.
Common tasks #
- Find a flaky test — scan recent runs for a serial that appears
with both
PassedandErroredoutcomes. - Compare two runs from the same UUT — find the two runs for that serial and open their detail pages in adjacent tabs.
- Watch live activity — leave the view open during a test run;
the table auto-refreshes on
run.started/run.endedevents.
Bookmarkable URL state #
This view does not currently encode filters or pagination in the URL — the page always opens with the default sort (Started, newest first) and the default 50-rows-per-page. Bookmarking the URL bookmarks the landing state, not the current view.
See also #
litmus runsCLI — the same data over the command line- Concepts → Outcomes — what each outcome value means and how rollups work
- Results — detail — the per-run view you reach by clicking a row