Events #
URL: /events
Browse the event log — the append-only stream of everything Litmus records: session lifecycle, run lifecycle, test step starts and ends, measurements, channel starts, instrument writes, operator dialogs, and diagnostics. The Results pages roll events up into runs; this page shows them raw.
Use it to debug timing ("why did this run pause for 4 seconds?"), trace instrument activity ("what did the DMM actually do during this test?"), or audit dialog responses ("did the operator confirm calibration before that batch?").
Filters #

| Filter | What it does | Notes |
|---|---|---|
| Session ID | Restrict to events for one session | Free-text. Full or short (first 8 chars) UUID works. |
| Event type | Pick one of 15 curated event types, or (any) for all | The event log can hold any event type; this dropdown lists the categories worth a one-click filter — it is not exhaustive. Other event types (e.g. fixture.uut_scanned, route.*, slot.*, stream.*) only appear under (any). See the Event types reference for the full list. |
| Role | Filter by instrument role (e.g. dmm, psu) | Free-text. |
| Since (ISO) | Earliest event timestamp | ISO-8601 string. |
| Limit | Maximum events fetched | Default 100, range 1–10,000. |
| Refresh | Force a re-fetch | Filter changes already auto-refresh. |
Table #
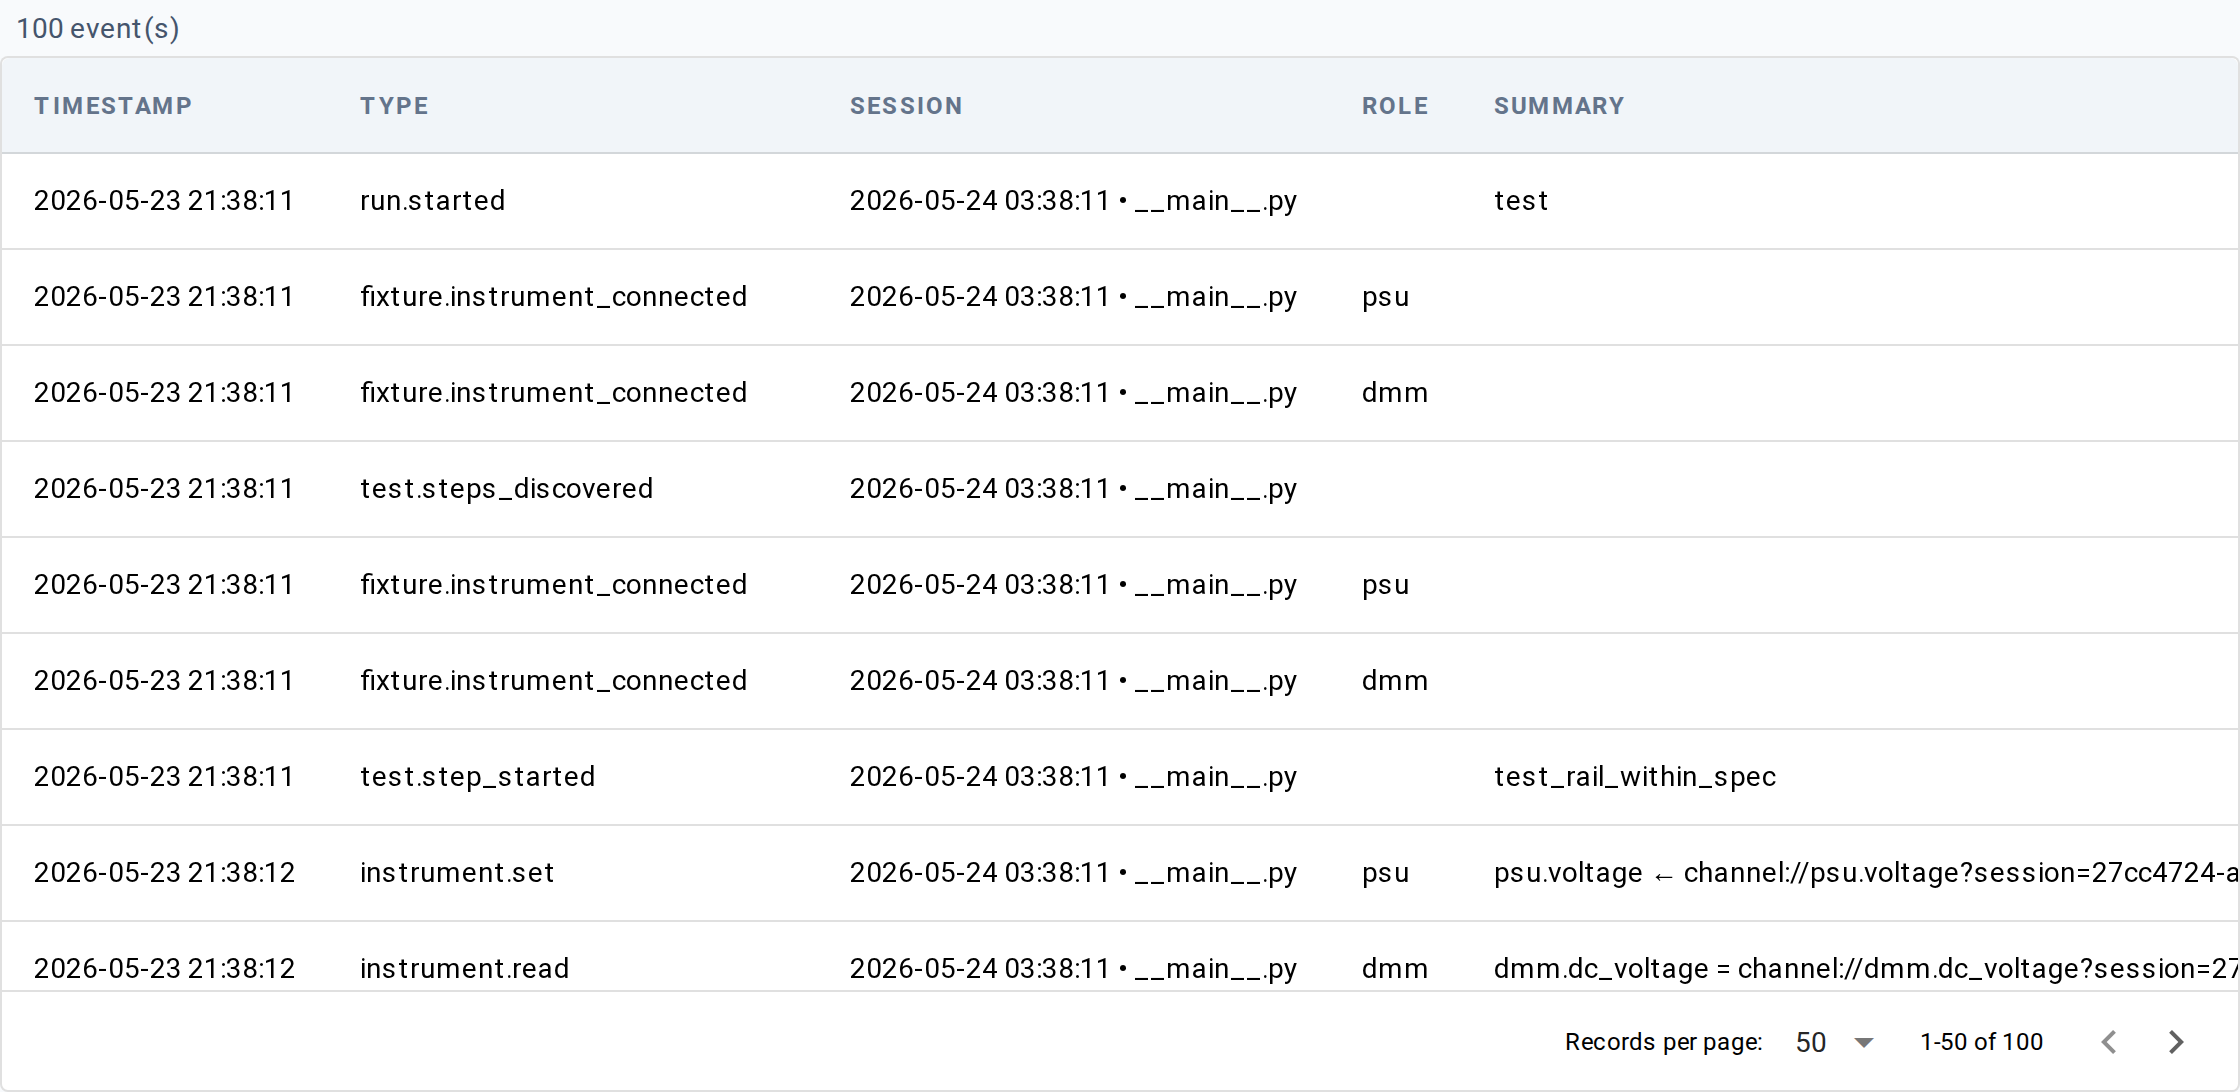
One row per event, newest first. Above the table a count tells you how many events matched.
| Column | What it shows |
|---|---|
| Timestamp | When the event was recorded, in browser-local time |
| Type | Event type (e.g. channel.started, test.measurement) |
| Role | Instrument or fixture role for events that carry one; otherwise blank |
| Summary | A type-specific one-liner — channel name for channel starts, measurement name + value + outcome for measurements, station id for session events, UUT serial for run events, step name for step events |
Click a row to open a detail dialog showing the full event JSON (every field on the event record).
When no events match, the table area shows "No events match the current filters." instead.
Bookmarkable URL state #
All filters serialize to query parameters so a URL captures the view:
| Parameter | Meaning |
|---|---|
session_id | Session UUID filter |
event_type | One of the dropdown values (or omitted for (any)) |
role | Instrument role filter |
since | ISO-8601 lower bound |
limit | Result cap (omitted at default 100) |
Underlying data #
The page reads from the event log — the same append-only stream every other view reads from. There is no first-class CLI equivalent today; events are observable in aggregate via the Runs / Metrics CLIs, and raw events can be read programmatically — see Querying events.
For the schema of each event type, see Event types reference.
For how the event log works, see Concepts → Event log.
Common tasks #
- Why did this run pause? — Filter by Session ID, sort by
timestamp, look for gaps between consecutive
test.step_*events. - Did the operator confirm before the batch? — Filter event type
to
dialog.openedthendialog.responded, narrow by Session ID. - Which channels did this test actually touch? — Filter event
type to
channel.started, scoped by Session ID.
See also #
- Results detail — the same events grouped into a single run's tabs
- Event types reference
- Concepts → Event log