Results — single run detail #
URL: /results/{run_id}
The detail view is what you land on after clicking a row in the Results list. It shows everything Litmus recorded for one run: a sticky summary header, an Overview with stats, and tabs for Steps, Measurements, the Execution Timeline (multi-slot runs only), and UUT History.
You can also leave it open during a run to watch progress live — the status chip shows a "Live" indicator and the tables fill in as steps and measurements arrive. See Live updates below.
If the run ID in the URL doesn't resolve, the page shows a "Run not found." card with a link back to the list.
Summary header #

The header sticks to the top of the viewport as you scroll the tab content. It carries:
| Element | What it shows |
|---|---|
| Title | The static label Test Run Summary |
| Outcome chip | Colored chip showing the current status. For finished runs the chip reads the final outcome (PASSED, FAILED, ERRORED, SKIPPED, TERMINATED, ABORTED, or DONE). For in-flight runs the chip reads RUNNING, and an animated blue dot + Live label appears next to it. |
| Back button | Returns to the Results list (/results) |
| Part Number | UUT part number stamped on the run |
| Serial | UUT serial number |
| Hostname | Station hostname that ran the test |
| Project | Project name from litmus.yaml |
| Started | Run start timestamp, rendered in browser-local time |
| Ended | Run end timestamp, — while the run is in-flight (replaced live when the run.ended event arrives) |
| View this run's… | Buttons that open the Events, Channels, and Files screens filtered to this run's session |
Tabs #
Below the header, a tab strip switches between five views. The
Execution Timeline tab only appears for multi-slot runs (sessions
with at least one measurement that carries a slot_id).
| Tab | What's there |
|---|---|
| Overview | Two stats cards summarising steps and measurements |
| Steps | The step table — one row per step execution, in execution order |
| Measurements | The measurement table — one row per recorded measurement |
| Execution Timeline | (multi-slot only) Gantt-style chart of all slots in the parallel session, with this run's slot highlighted |
| UUT History | A short list of other runs for the same UUT serial |
The active tab is mirrored into the URL (?tab=Steps, ?tab=Measurements,
etc.), so a bookmark lands the reader back on the same tab.
Overview #
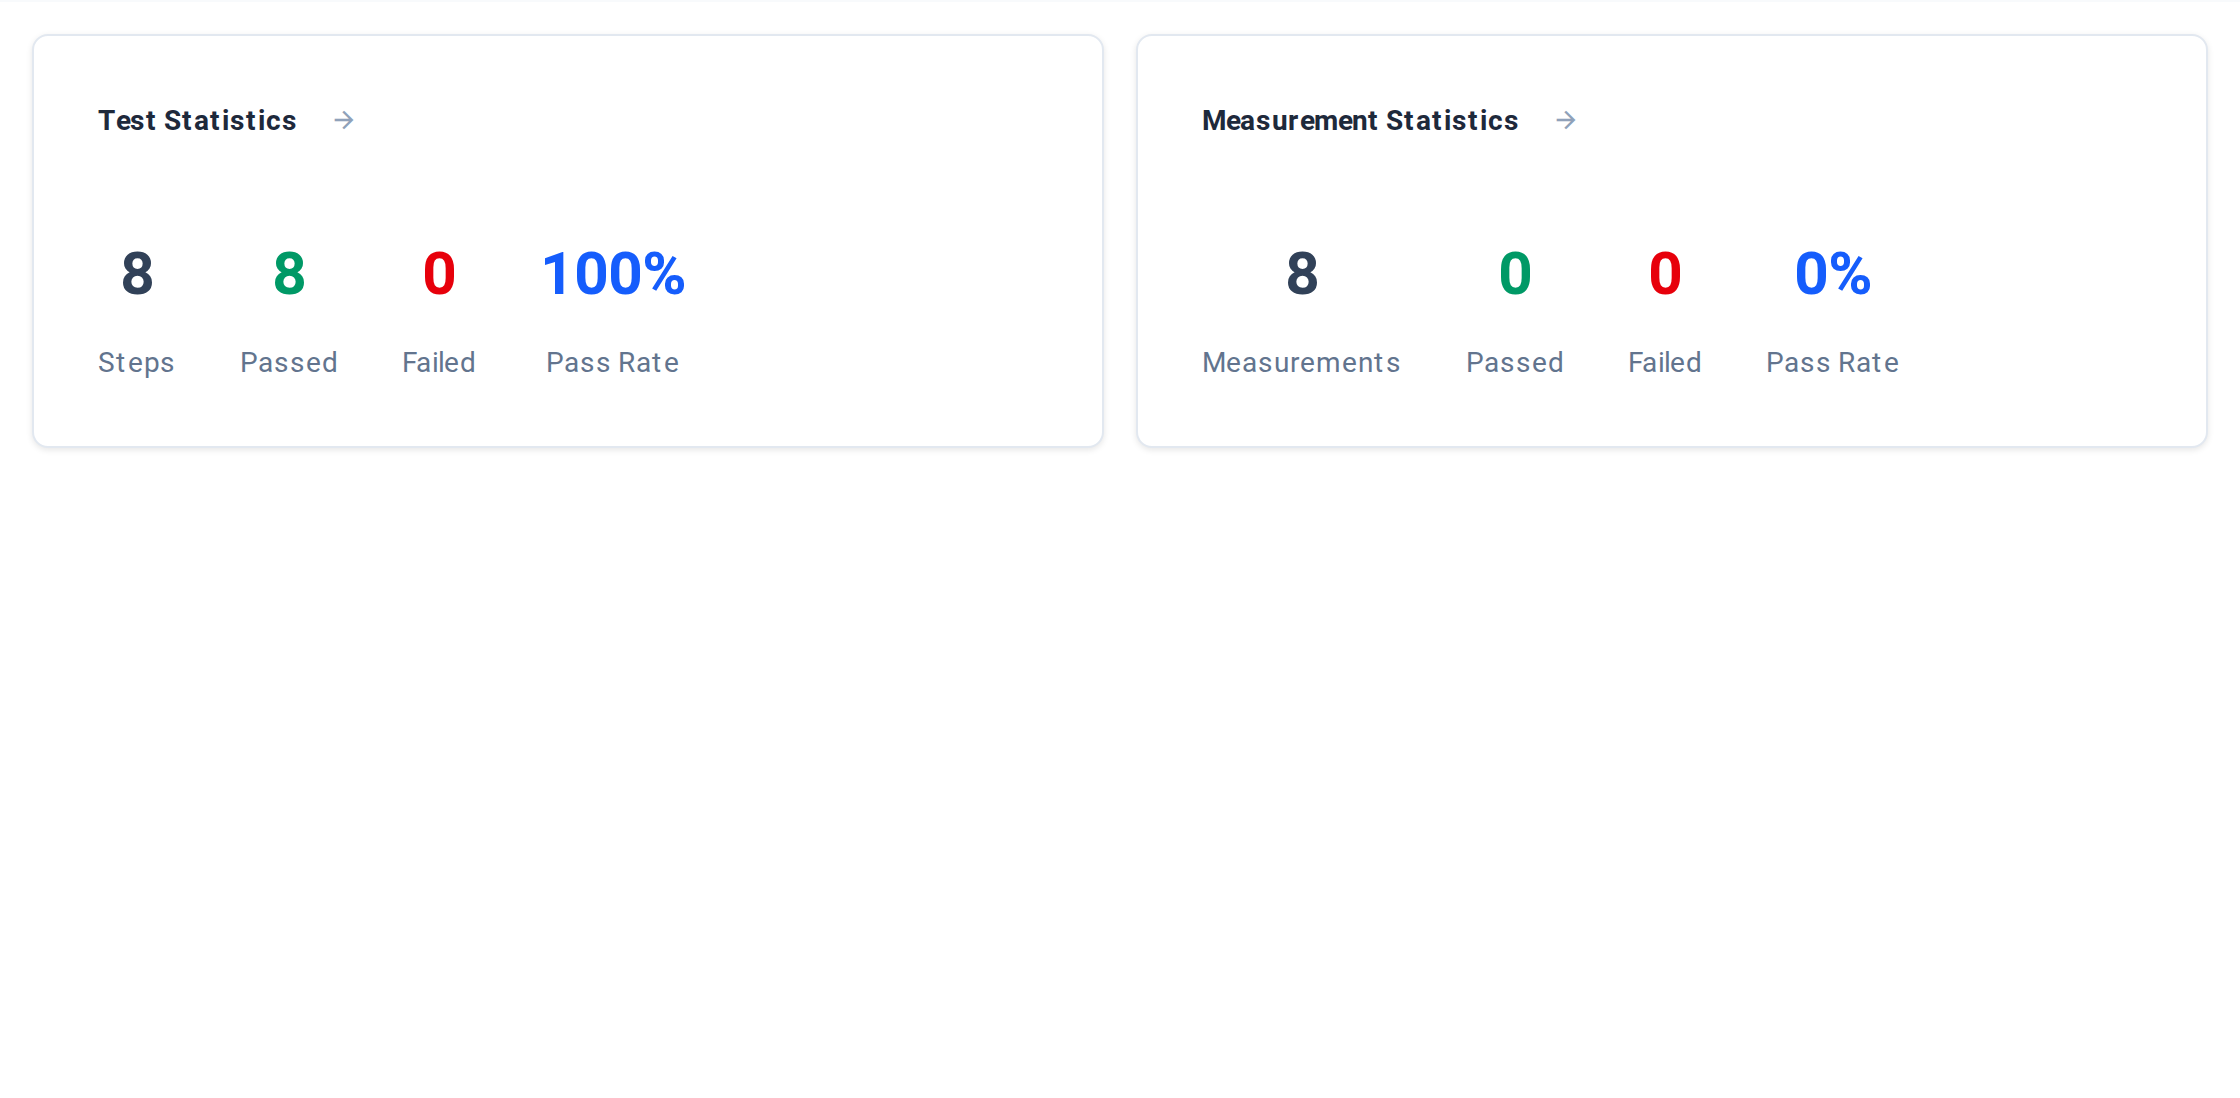
Two cards. Each is clickable — click anywhere on a card to jump to the corresponding tab.
Test Statistics:
| Stat | Meaning |
|---|---|
| Steps | Total step count for the run |
| Passed | Steps whose outcome is not Failed. Note this counts Errored, Skipped, and in-flight steps as passed too — it's a total − failed calculation, not "judged passed." |
| Failed | Steps whose outcome rolled up to Failed |
| Pass Rate | Passed / Steps, rendered as a percentage rounded down (e.g. 99.7% shows as 99%). Shown only when the run has at least one step. |
Measurement Statistics:
| Stat | Meaning |
|---|---|
| Measurements | Total measurement count for the run |
| Passed | Measurements with outcome Passed |
| Failed | Measurements with outcome Failed |
| Pass Rate | Passed / Measurements, rendered as a percentage rounded down. Shown only when the run has at least one measurement. |
Steps #
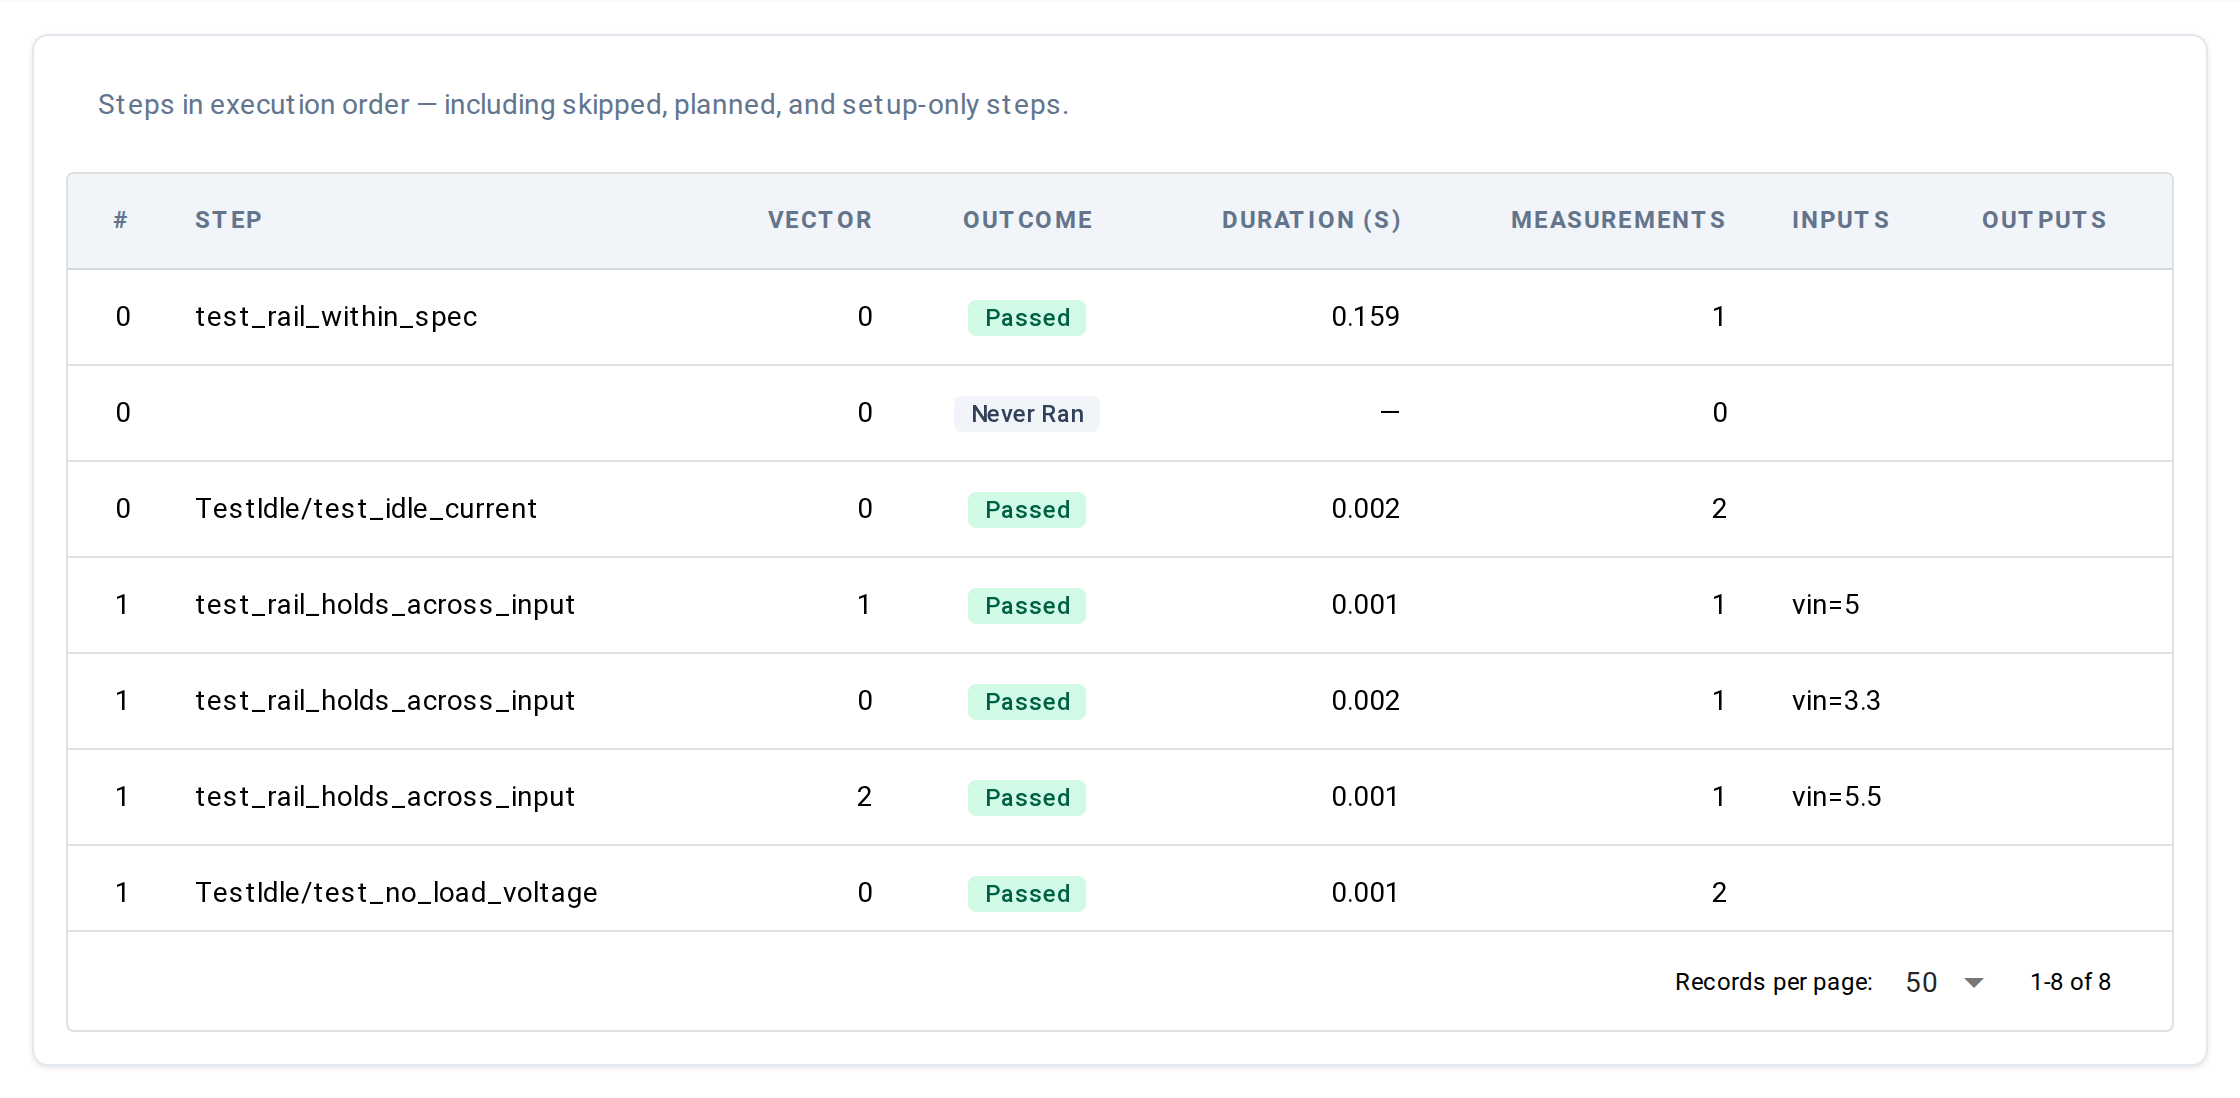
One row per step execution, in execution order — including skipped, never-run, and setup-only steps.
| Column | What it shows |
|---|---|
| # | Sequence-relative position within the parent step. Sweep variants of the same step share this number, distinguished by Vector. |
| Step | Sequence-qualified path (e.g. TestPowerSequence/test_efficiency). Falls back to the step name when no path is recorded. |
| Vector | Which sweep variant. 0 for non-swept steps; otherwise 0..N-1 across the variants of a step. |
| Outcome | Colored chip showing the step's outcome. Beyond the final-state vocabulary listed for the header chip, step rows can also show RUNNING (step in flight), WAITING (queued / setup-only), and NEVER RAN (collected but never started). |
| Duration (s) | Wall-clock duration in seconds, formatted to 3 decimals. — when the step hasn't finished. |
| Measurements | Number of measurements recorded inside this step |
| Inputs | Commanded sweep parameters for this step / vector, rendered as compact key=value pairs (bare parameter names, e.g. freq=1000.0, level=-10.0). Blank for non-swept steps. |
| Outputs | Recorded vector-level observations for this step / vector, in the same compact key=value form. Blank when none were stamped. |
Empty steps render the No steps recorded yet. message in the table
body until the first row arrives.
Measurements #
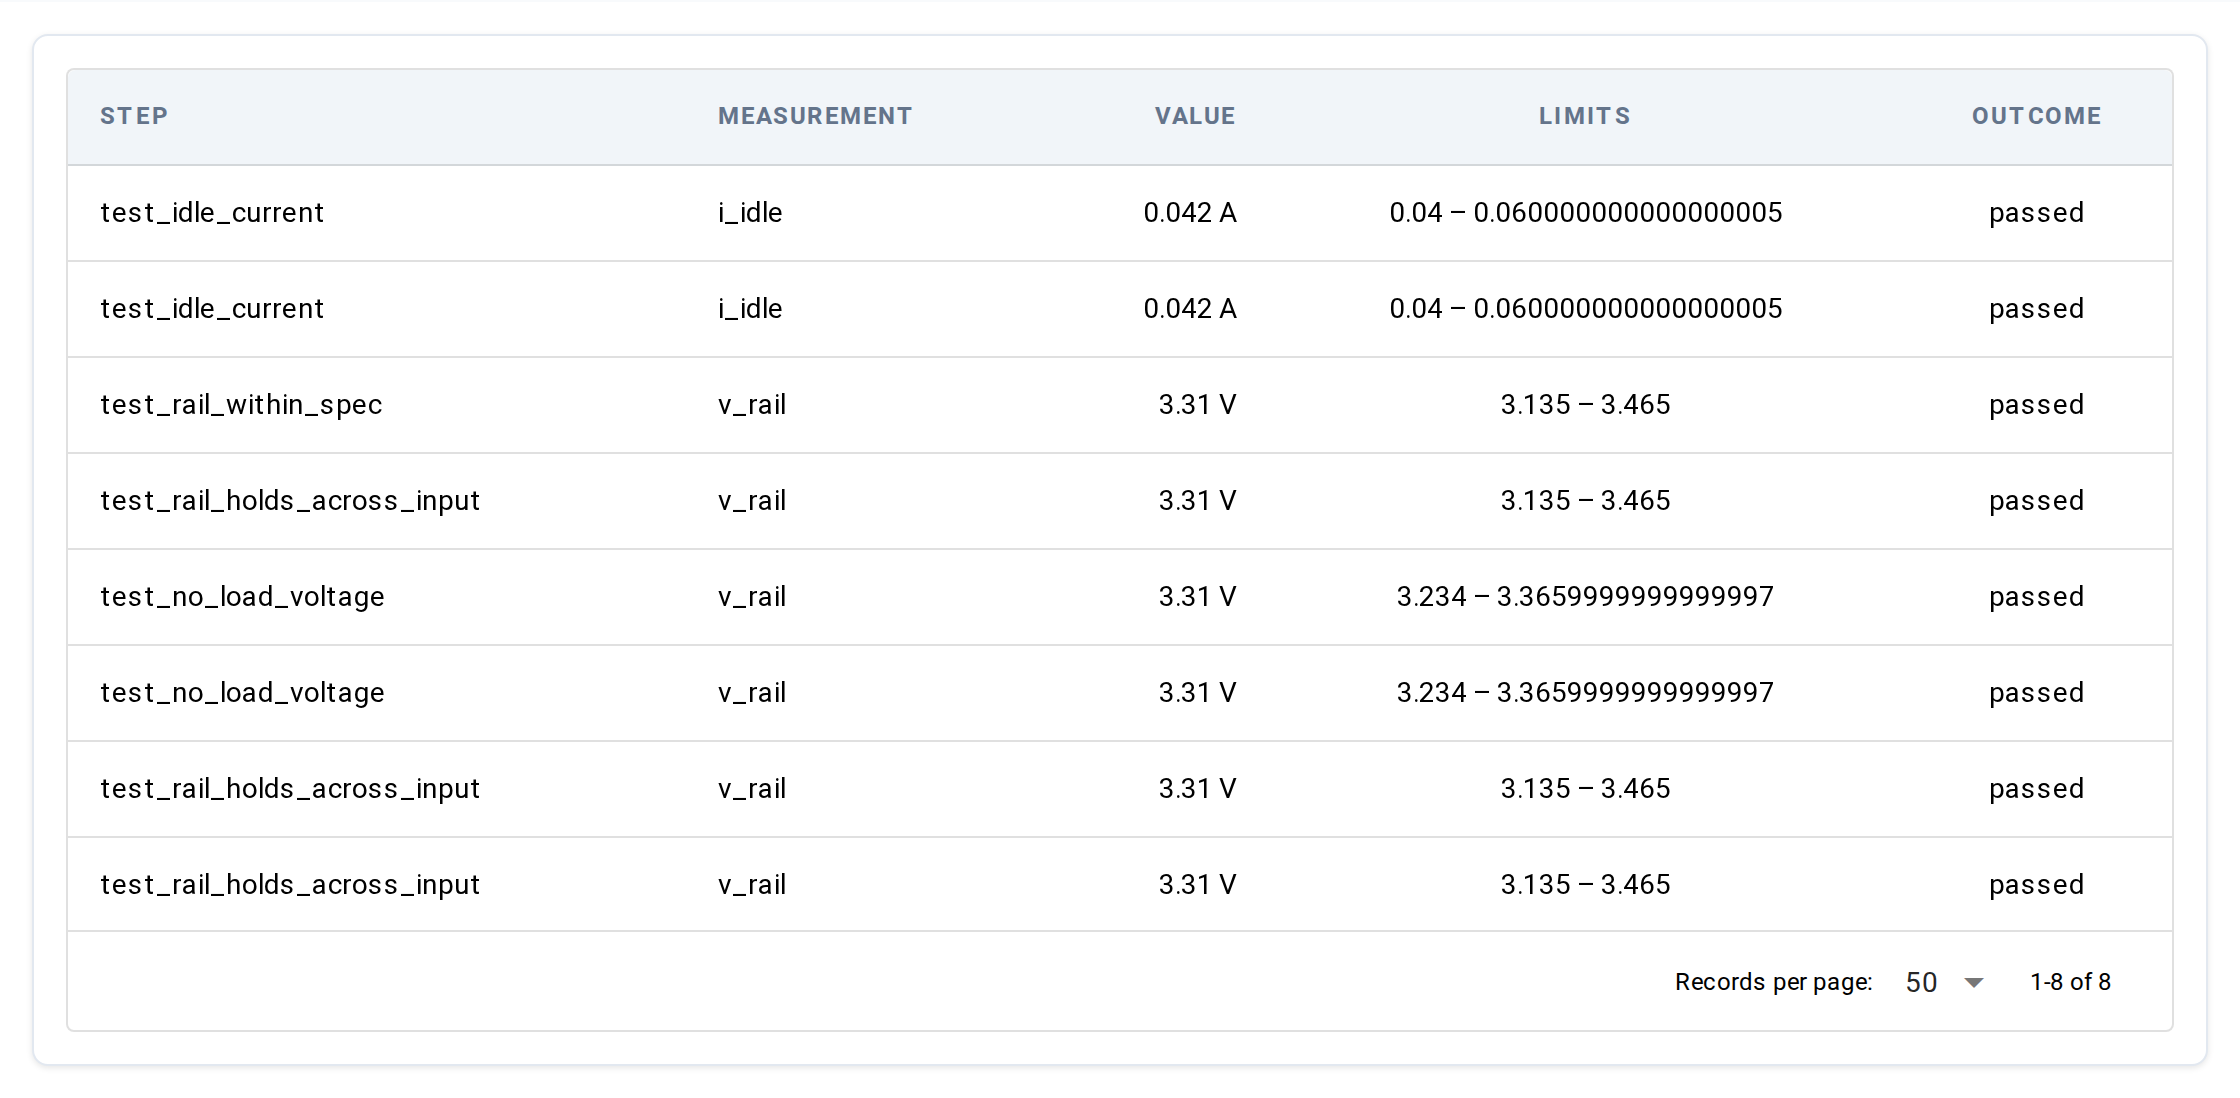
One row per recorded measurement. Use this view when you care about the values themselves, not the step structure around them.
| Column | What it shows |
|---|---|
| Step | The step name this measurement belongs to |
| Measurement | The measurement name passed to verify or measure |
| Value | Measured value with units appended (e.g. 3.31 V). — when the measurement recorded no value (errored). |
| Limits | The low–high band the value was checked against (e.g. 3.135 – 3.465). — when no limit was active. |
| Outcome | Colored chip showing the measurement outcome |
Below the table, an Artifacts card appears only when at least one measurement carries an attached artifact (waveforms, screenshots, logs, files). Each measurement with artifacts gets a row of buttons you can click to download or view inline.
Empty measurements render the No measurements recorded yet. message
until the first row arrives.
Execution Timeline (multi-slot only) #
The Execution Timeline tab only appears for multi-slot parallel
sessions — runs where at least one measurement carries a slot_id.
It loads on demand: the first time you click the tab, the chart
fetches the session's full step list and draws a Gantt of every
slot's activity, with this run's slot highlighted.
For single-slot runs (the common case) the tab is hidden entirely.
UUT History #
A short table of other runs for the same UUT serial — useful for "is this unit's last 5 runs all green?" checks. Loads on demand on first click. Up to 10 rows, drawn from the project's most recent 100 runs — older history for the same UUT isn't shown here. Click any row to jump to that run's detail page.
When no other runs exist for the UUT serial within that window, the
tab body shows No other runs found for UUT: <serial>.
Live updates #
When you open the page on an in-flight run, four event types feed live updates:
run.ended— flips the status chip fromRUNNINGto the final outcome, fills in theEndedtimestamp, and stops the Live indicatortest.step_startedandtest.step_ended— refresh the Steps table and the Overview statstest.measurement— refreshes the Measurements table and the Overview stats
Once the run ends, the page stops watching for updates and keeps the final values. If live updates aren't available when the page loads, the page stays static — refresh manually to see new rows.
Underlying data #
The detail view shows the run header/status, its steps, and its measurements — the same run data as the Results list, with the step and measurement detail. The same data is available from the CLI and Python:
litmus show {run_id}— pretty-printed overview;-f jsonfor machine-readable,-f html/pdffor a rendered reportlitmus export {run_id} -f csv|json|stdf|hdf5|tdms|mdf4— dump the run in a downstream-tool format
For the Python equivalents, see RunsQuery and friends.
For the underlying schemas, see
Models reference → RunSummary,
TestStep, and
Measurement.
Common tasks #
- Drill into a failing measurement — open the Measurements tab,
scan for
FAILEDchips, then jump to the UUT History tab to see whether the prior run for the same UUT had the same failure. - Pull a waveform or log — Measurements tab, scroll to the Artifacts card below the table, click the artifact button.
- Watch a long test live — open the detail page during the run
and leave it; the chip shows
RUNNINGwith a Live dot, and tables fill in as steps and measurements arrive.
Bookmarkable URL state #
The active tab is mirrored into the URL via the tab query parameter:
| URL | Tab |
|---|---|
/results/{run_id} | Overview (default) |
/results/{run_id}?tab=Steps | Steps |
/results/{run_id}?tab=Measurements | Measurements |
/results/{run_id}?tab=Execution%20Timeline | Execution Timeline (multi-slot only) |
/results/{run_id}?tab=UUT%20History | UUT History |
Bookmarking the URL bookmarks the run + the open tab.
See also #
- Results list — the table you came from
litmus showCLI — the same data over the command line- Concepts → Outcomes — what each outcome value means and how rollups work
- Concepts → Step hierarchy — how classes, methods, and vectors nest in the Steps table