Metrics #
URL: /metrics
The Metrics view answers fleet-level questions across all runs in the index. Six tabs share one filter bar: Yield, Pareto, Ppk, Retest, Time loss, Assets.
Filter bar #

| Control | What it filters | Notes |
|---|---|---|
| Phase | Test phase (development, validation, characterization, production) | Multi-select. Defaults to production — set it explicitly to include other phases. |
| Part | UUT part number | Multi-select. Populated from runs in the index. |
| Station | Station hostname | Multi-select. Populated from runs in the index. |
| Lot (optional) | Lot identifier | Free-text. Leave blank for all. |
| Since (optional) | Earliest run start, YYYY-MM-DD | Date picker, or type the date directly. Defaults to 30 days ago when left blank. |
| Until (optional) | Latest run start, YYYY-MM-DD | Date picker, or type directly. Defaults to now when left blank. |
| Refresh | Force a re-fetch of the active tab | Filter changes already re-fetch automatically; use Refresh only to pick up new runs that arrived while the page was open. |
All filters apply to every tab except Assets, which is keyed by instrument role + resource rather than by run context.
The active tab fetches its data once and caches the result. Switching to a tab you've already loaded reuses the cached result; changing any filter clears all caches so every tab re-fetches on next visit.
Tabs #
The filter bar is shared. Each tab below shows a different lens on the same filtered set of runs.
Yield #
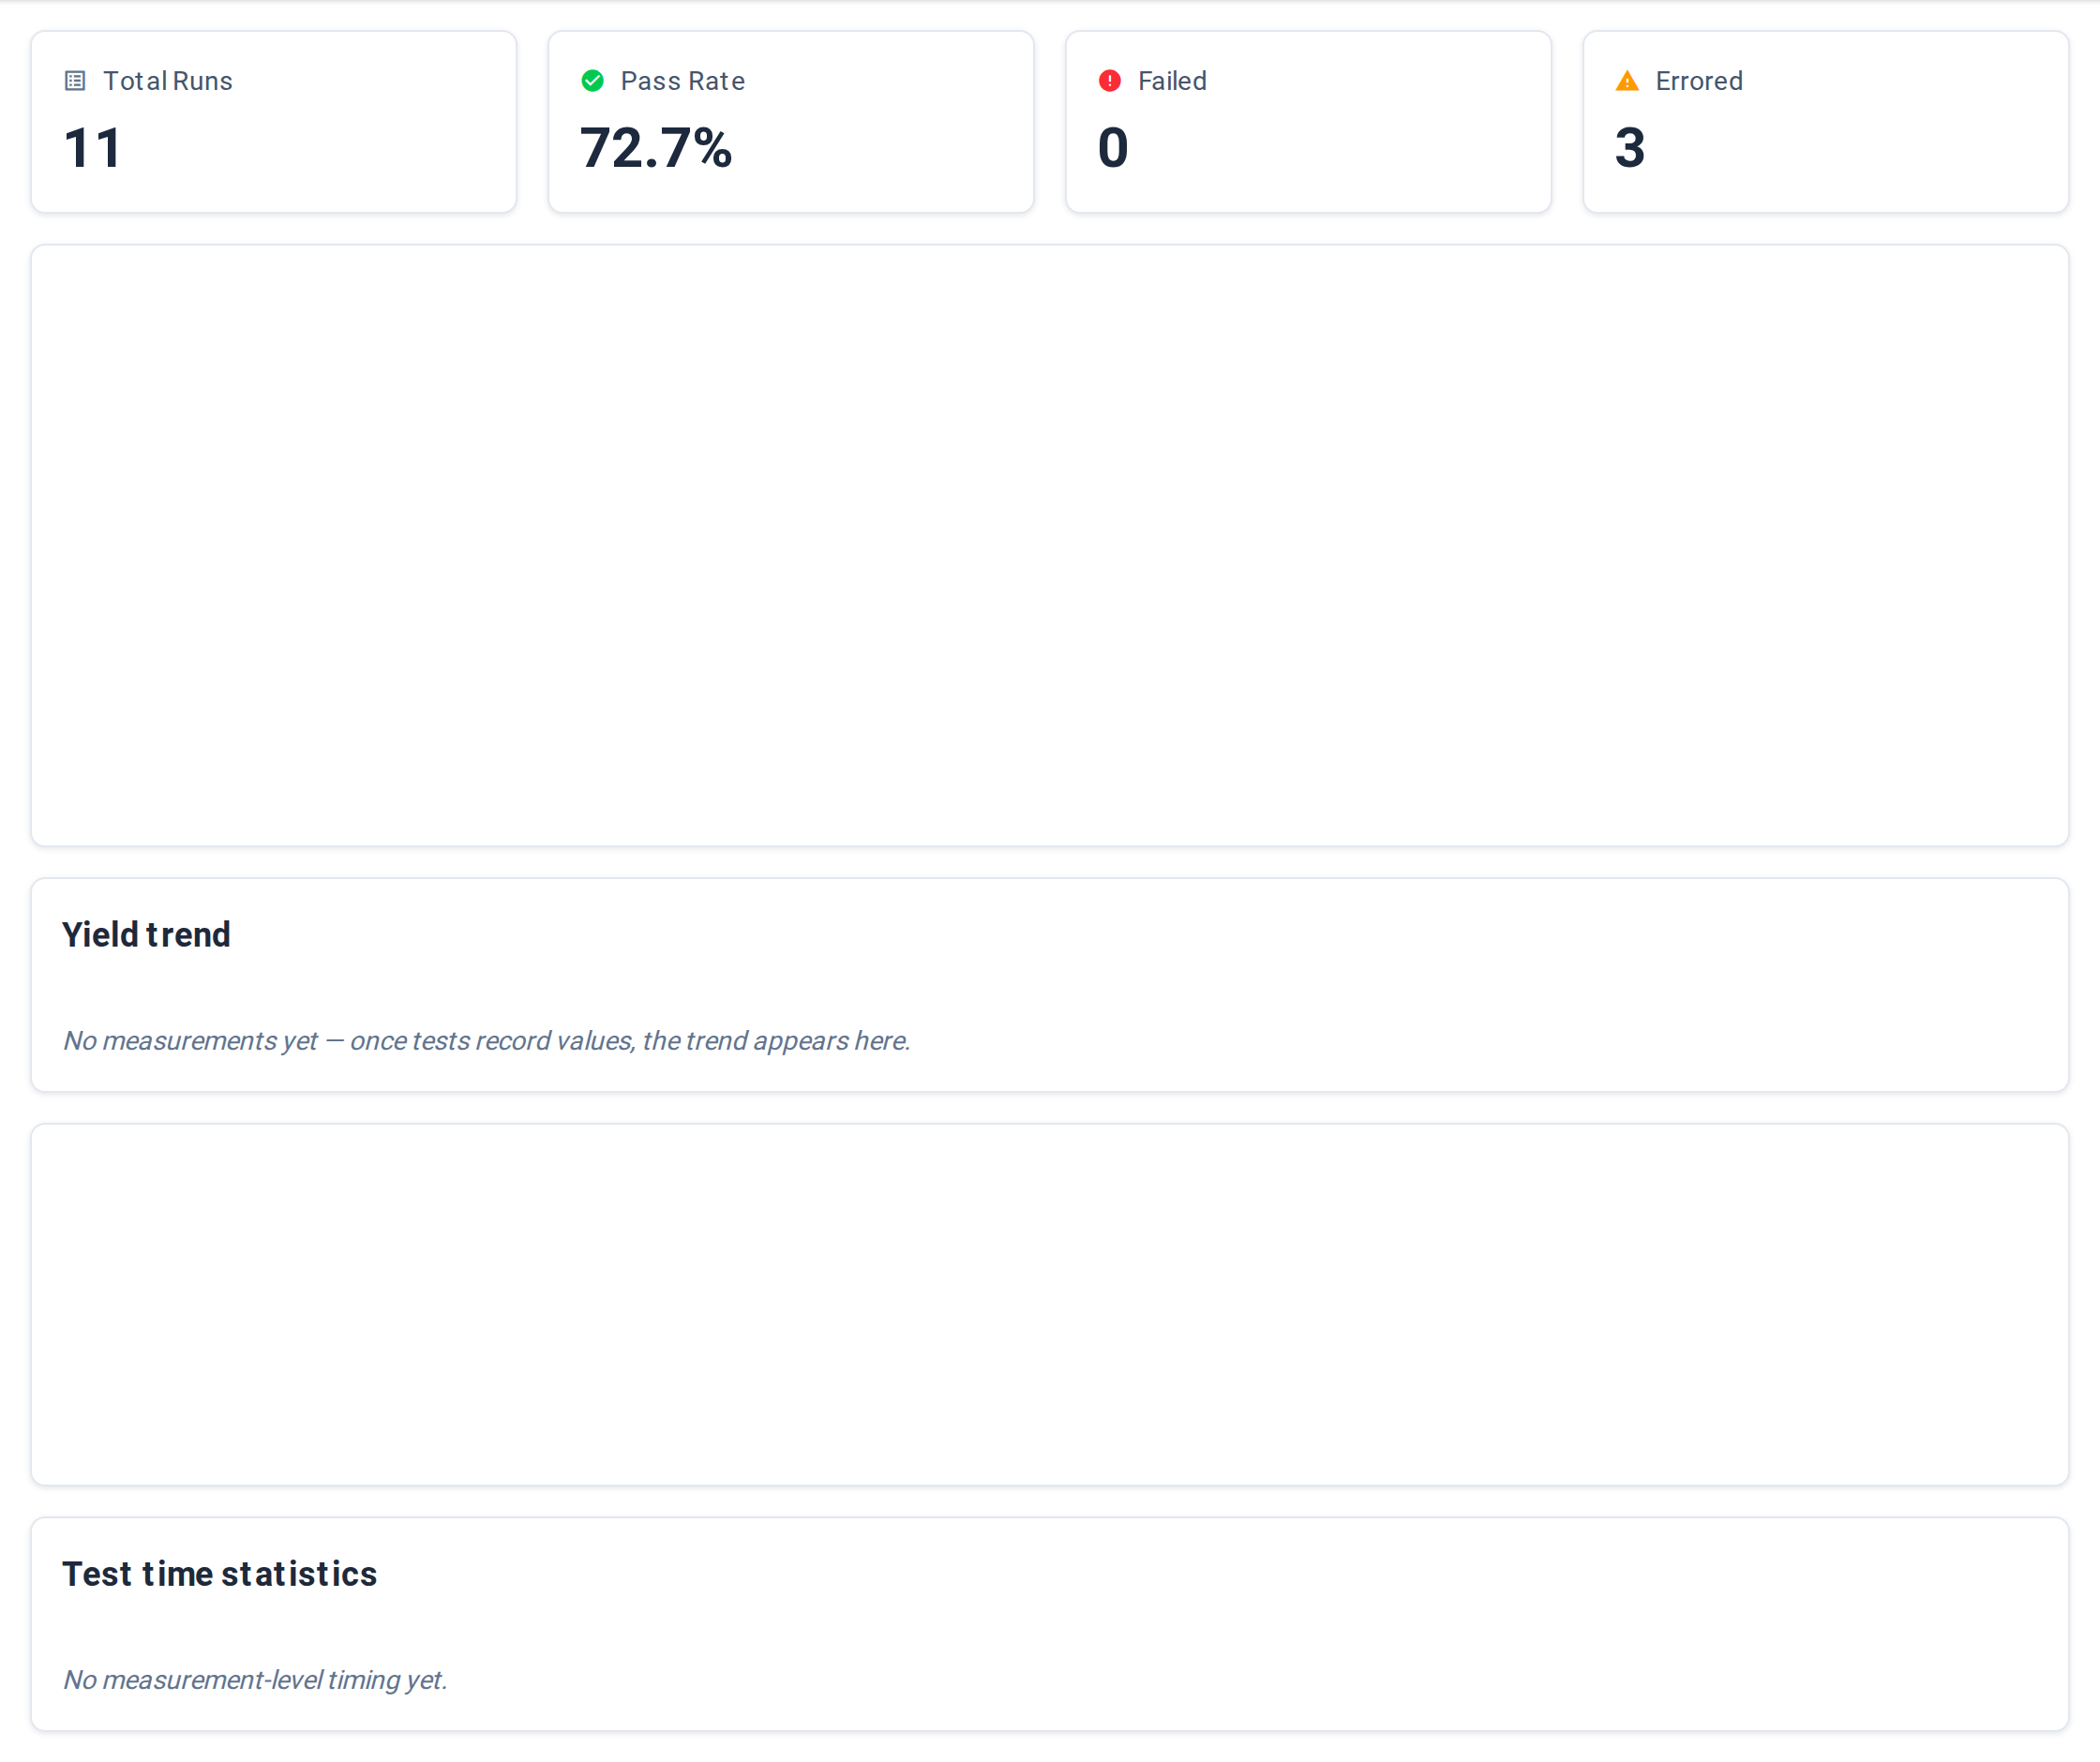
The default landing tab. Three blocks stacked vertically.
Summary cards (top row, 7 cards):
| Card | Meaning |
|---|---|
| First Pass Yield | Percentage of UUT serials that passed on their first run |
| Final Yield | Percentage of UUT serials that ultimately passed (first run or any retest) |
| RTY | Rolled throughput yield — the chance a unit clears every step with no rework |
| Total Runs | Run count in the filtered window |
| Total Failures | Run count with outcome Failed only. Errored runs are tracked separately under Time loss; they don't roll into this count. |
| DPMO | Defects per million opportunities |
| DPPM | Defective parts per million |
Yield Trend Over Time — line chart of yield percentage bucketed by day. The window's resolution is always daily; longer ranges show more daily points, not a coarser bucket.
Test Time Statistics — 4 cards summarising per-run duration: Average, Minimum, Maximum, P95.
Pareto #
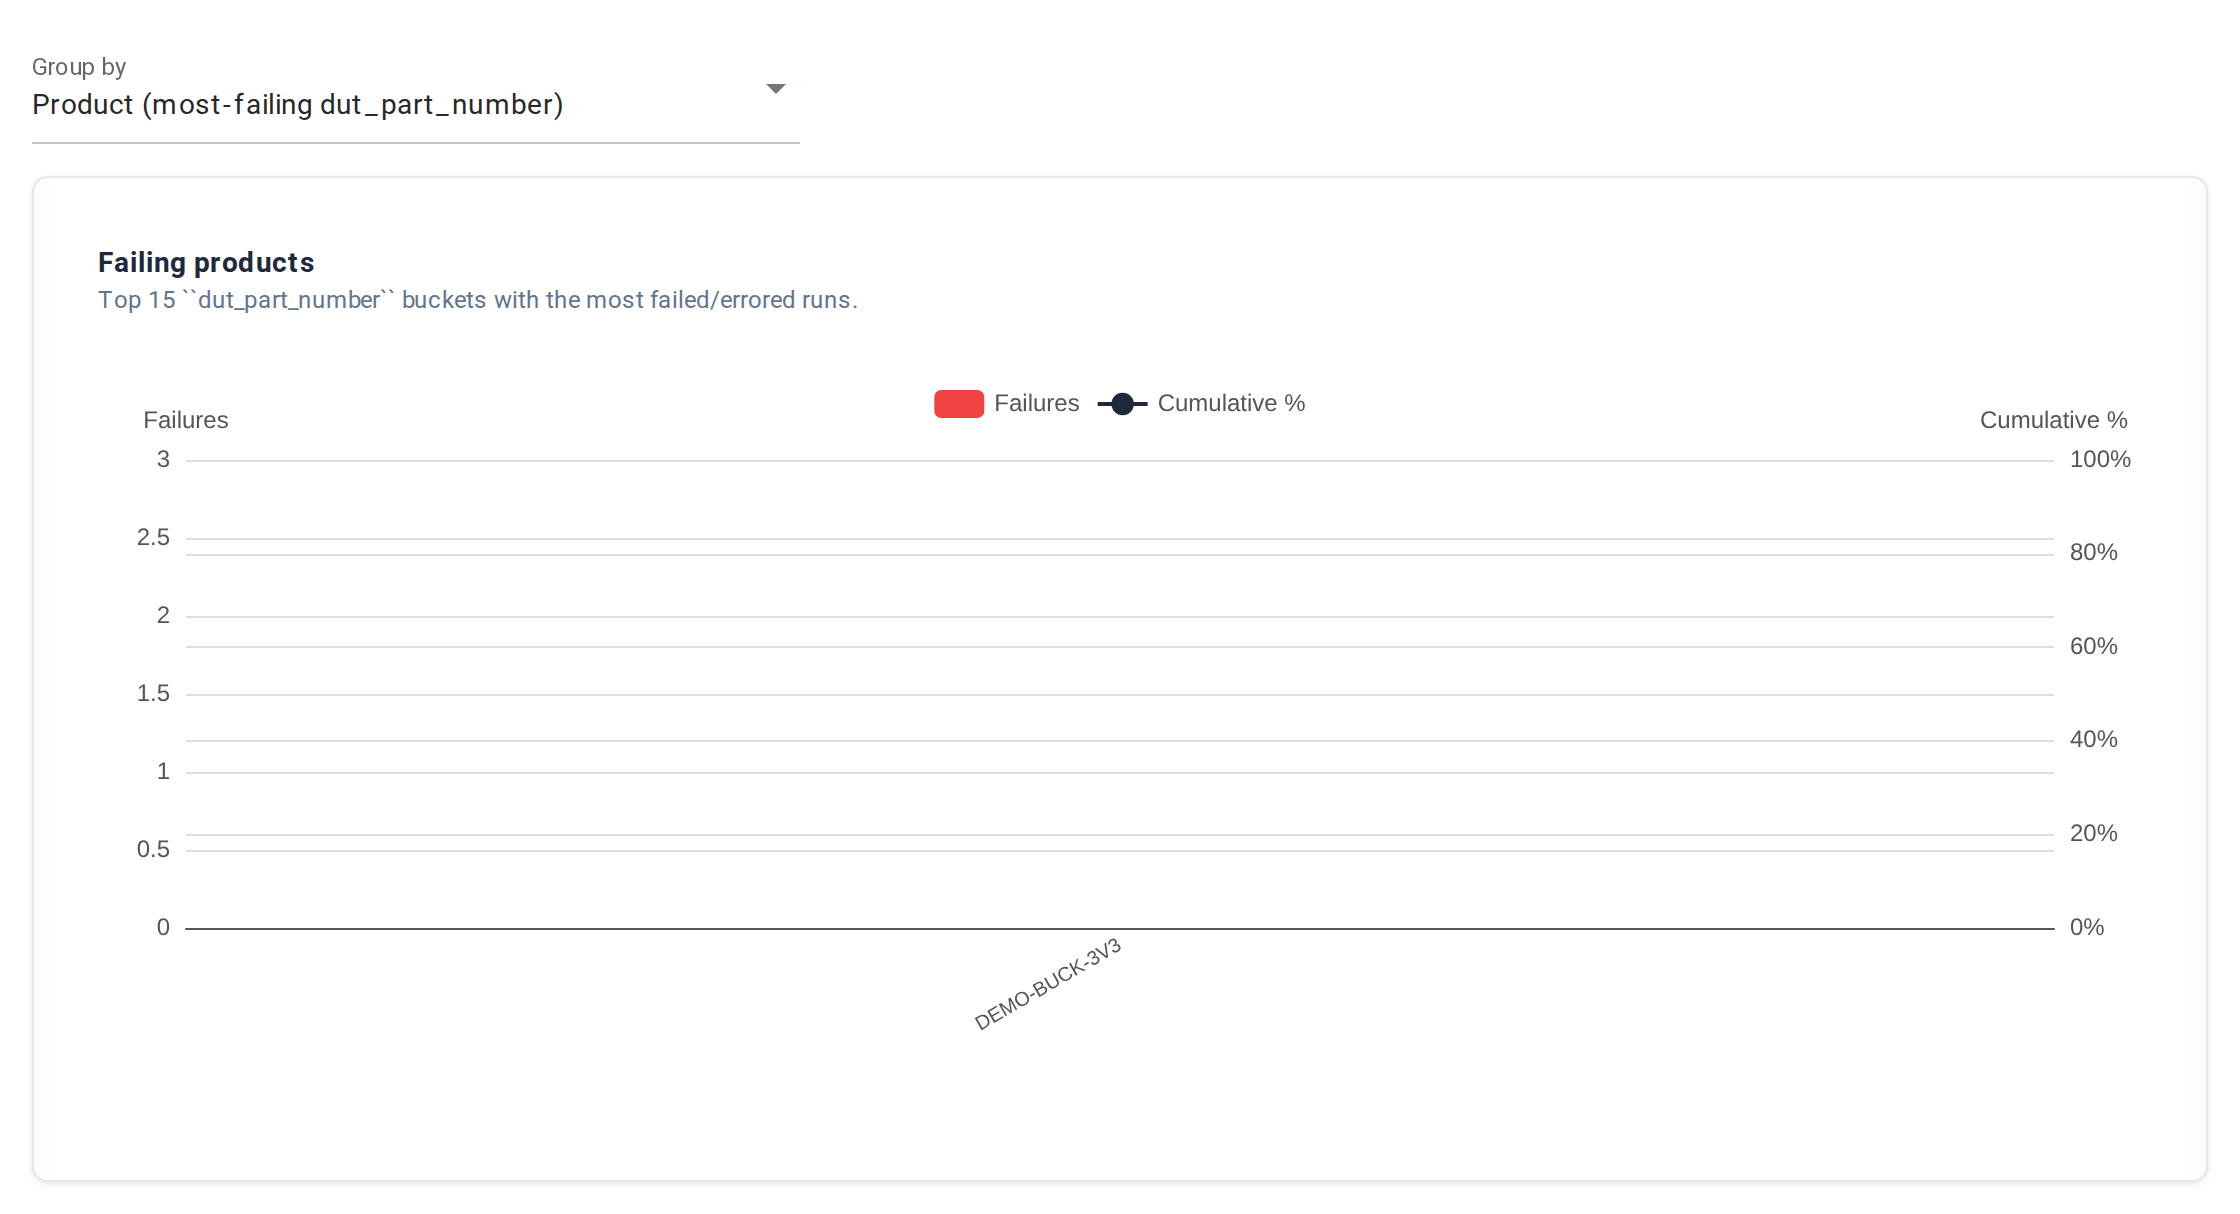
Bar chart of failure counts grouped by one of three lenses
selectable via the Group by dropdown above the chart (URL
parameter: pareto_group):
| Group | Bars show |
|---|---|
| Part | Most-failing UUT part numbers |
| Step | Top failing steps, grouped by step path, across the filtered runs |
| Measurement | Top 15 measurements with the most failures. Limited to limit-bearing measurements. Bars are labelled step_name: measurement_name so the same measurement name under different steps shows as distinct bars. |
The leftmost bar is the biggest single contributor to lost yield.
Ppk #
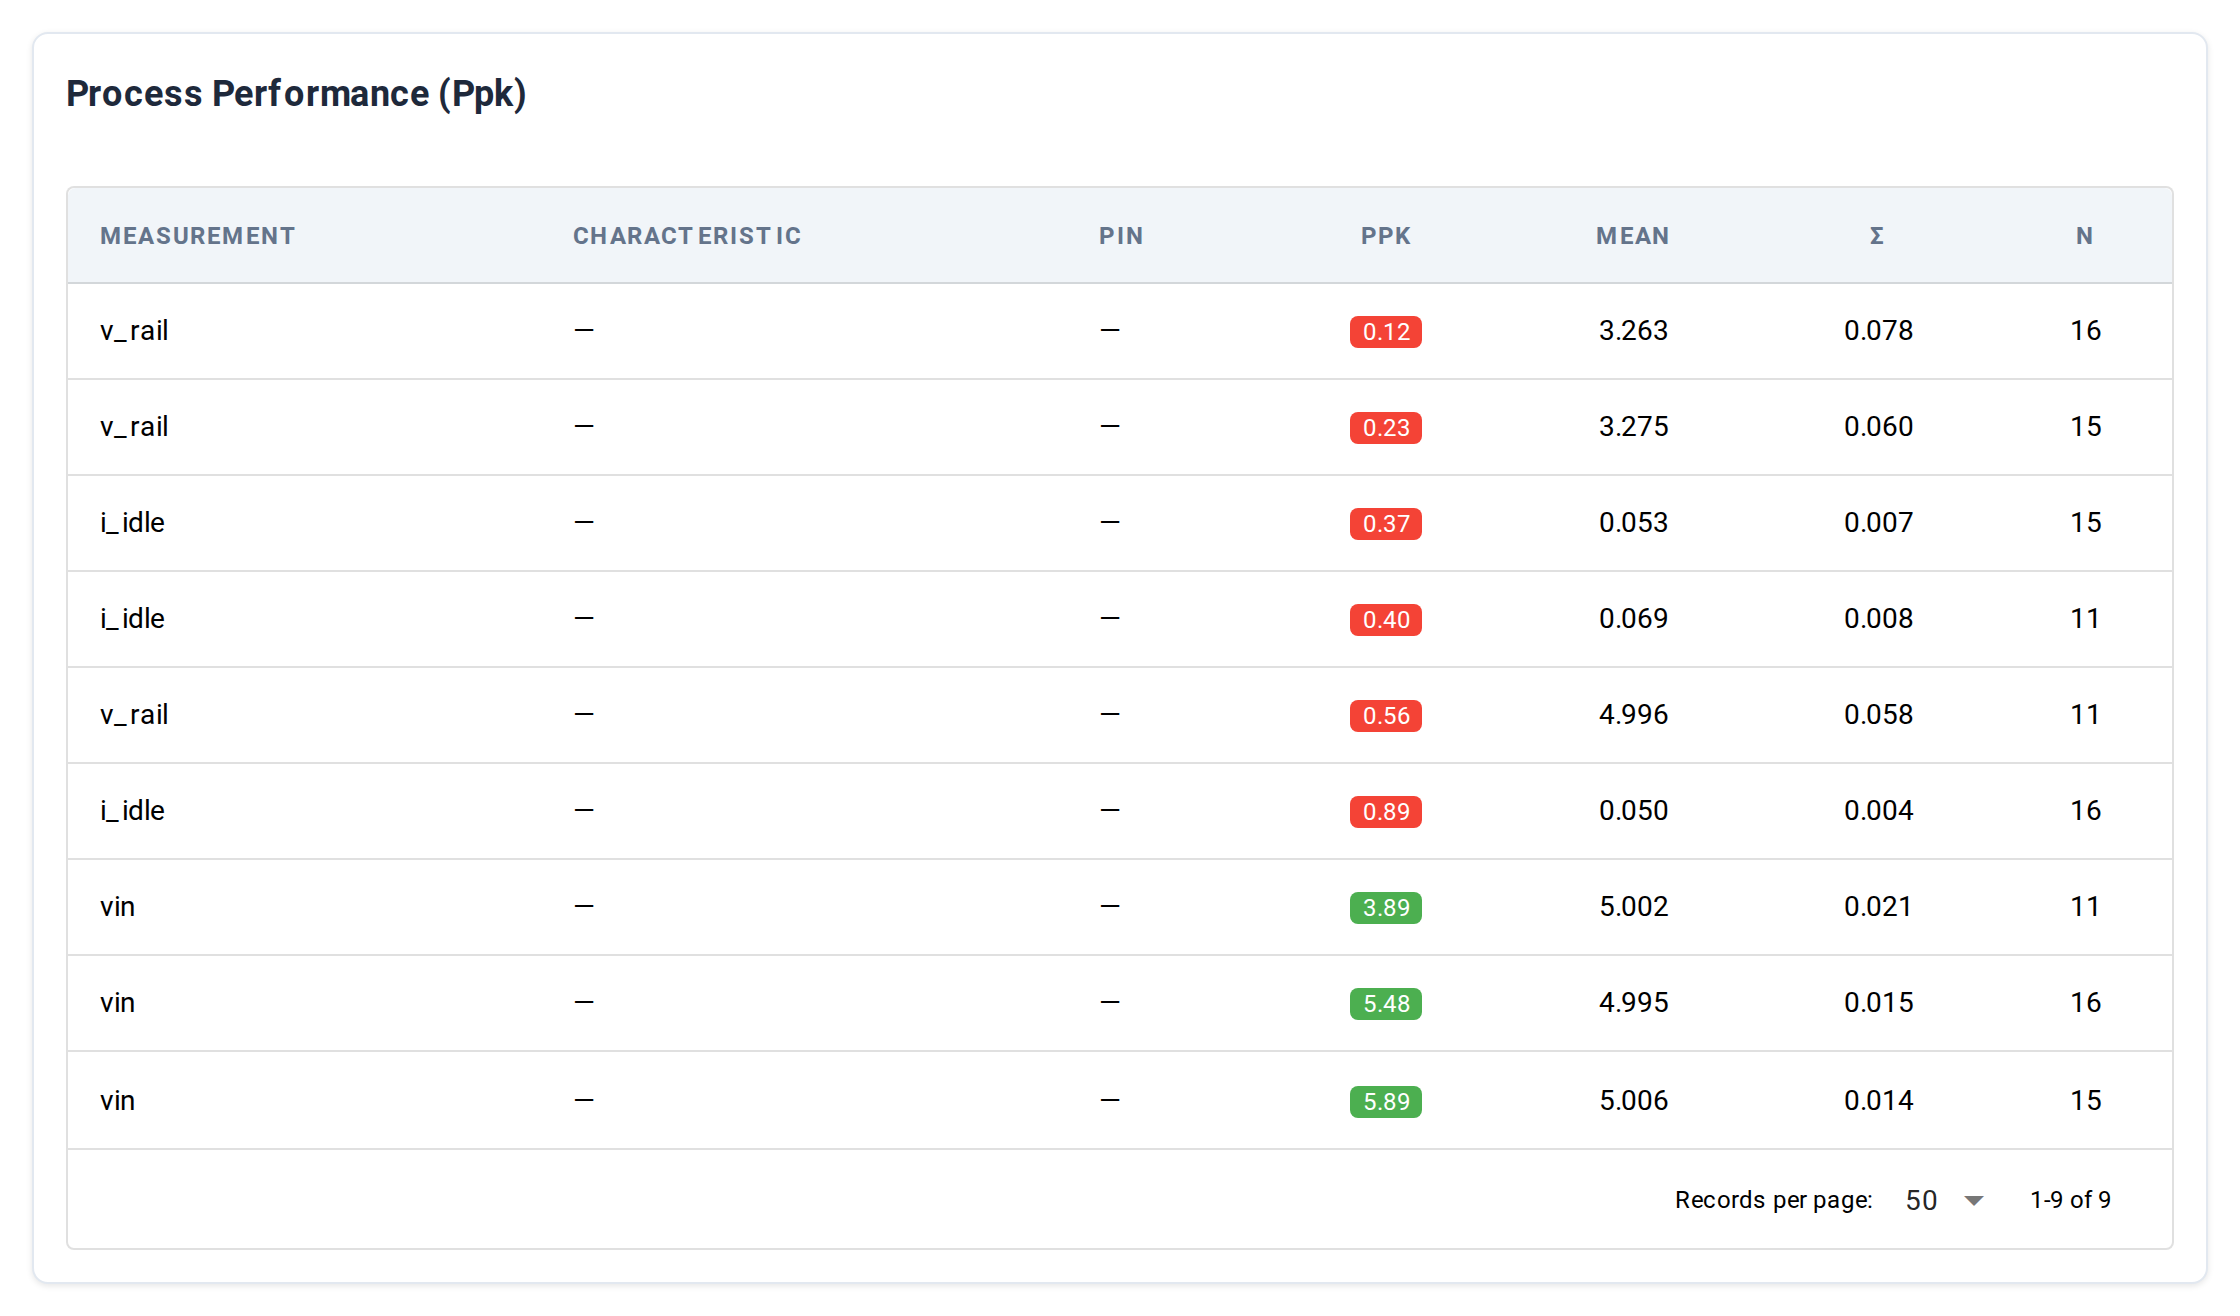
Process Performance index per measurement — how much margin each measurement has against its limits. Top 15 measurements ranked by Ppk ascending (worst Ppk first, so the table opens on what needs attention).
| Column | What it shows |
|---|---|
| Measurement | Measurement name |
| Characteristic | The part characteristic the measurement maps to, when one is configured |
| Pin | The UUT pin, when configured |
| Ppk | Ppk value. Color-coded: green ≥ 1.33, orange ≥ 1.00, red < 1.00. N/A (grey) when Ppk can't be computed — typically zero variance across samples, or no limits configured on the measurement. |
| Mean | Sample mean |
| σ (sigma) | Sample standard deviation |
| n | Sample count |
A measurement that doesn't appear in this table either has no limits configured or has fewer than 10 samples in the filtered window (the minimum-sample threshold for the Ppk calculation).
Retest #
Bar chart + table of retest activity per daily period:
| Column | What it shows |
|---|---|
| Period | Daily bucket |
| Serials | Distinct UUT serials tested in the day |
| Retested | UUT serials that ran more than once |
| Rate | Retested / Serials as a percentage |
| Avg retries | Mean number of retries (executions − 1) across all UUTs in the day. A day where every UUT ran once shows 0.00; a day where some UUTs ran twice or more shows a fractional value. |
When no rows exist, the tab shows a message about how retest data is populated.
Time loss #
Stacked-bar chart + table of wall-clock time spent per daily period, split by outcome:
| Column | What it shows |
|---|---|
| Period | Daily bucket |
| Total (s) | Total wall-clock test time in the day |
| Pass (s) | Time spent on passing runs |
| Fail (s) | Time spent on failed runs |
| Error (s) | Time spent on errored runs |
The chart's stacked bars use green / red / amber for pass / fail / error.
Assets #
Per-instrument utilization across the selected date window. Phase / Part / Station filters don't apply here — instruments are keyed by role + resource, not by run context.
| Column | What it shows |
|---|---|
| Role | Instrument role (e.g. dmm, psu) |
| Resource | VISA / SCPI / serial resource string |
| Sessions | Distinct connect-to-disconnect intervals in the window |
| Connected (s) | Total seconds the instrument was connected |
| Share | Percentage of total instrument-connected time in the window |
A blank Since means "no lower bound" — Litmus uses every event it
has. A blank Until means "up to right now."
When the window is empty (no instrument connect/disconnect events recorded), the tab shows a message about how the data is populated.
Bookmarkable URL state #
Every filter and the active tab are written to the URL as query parameters, so a URL captures the exact view:
| Parameter | Meaning |
|---|---|
phase | Repeat for each selected phase: ?phase=production&phase=validation |
part | Repeat per selected part |
station | Repeat per selected station |
lot | Lot filter value |
since, until | Date range, YYYY-MM-DD |
tab | Yield (default), Pareto, Ppk, Retest, Time loss, or Assets |
pareto_group | part, step, or measurement (only meaningful on the Pareto tab) |
Sharing a Ppk URL with the Pareto group set has no effect — irrelevant parameters are ignored by tabs that don't use them.
Underlying data #
The page reads from the same runs / measurements index as the
Results list, with per-tab aggregation queries
running on demand when the tab loads. When a run finishes, the page
picks up the new data automatically (it watches for run.ended) —
no Refresh needed.
CLI equivalents per tab, all accepting the same filter flags
(--phase, --part, --station, --since, --until)
and --json for machine-readable output:
| Tab | CLI |
|---|---|
| Yield (cards + Test Time Statistics) | litmus metrics summary |
| Yield Trend Over Time chart | litmus metrics trend |
| Pareto | litmus metrics pareto |
| Ppk | litmus metrics ppk |
| Retest | litmus metrics retest |
| Time loss | litmus metrics time-loss |
| Assets | (no CLI equivalent yet) |
The same queries are available as Python classes in the analysis module — useful for embedding metrics into a notebook or a custom report.
Common tasks #
- Find the dominant failure mode — Pareto tab, set Group by to
Step, thenMeasurement. The leftmost bar is the biggest single source of failures. - Spot a measurement riding the limit — Ppk tab, scan for orange or red chips (Ppk < 1.33). Note the measurement name, then open the Results list, drill into a recent run, and search the Measurements tab for that name to see the actual values. (The Ppk table itself doesn't link out.)
- Justify a new station — Time loss tab, sum the fail + error columns over the last month. Compare with the cost of operator rework.
- Share an investigation snapshot — set the filters, copy the URL, paste it into a chat or ticket. The recipient sees the same view.
See also #
- Results list — the run-level table this rolls up from
litmus metricsCLI group — per-subcommand links are in Underlying data above- Concepts → Outcomes — how pass / fail / error are decided in the first place